Windows (optionally) adds the Diagnostics Tool as a Startup program after successful installation of EventTracker. Diagnostics Tool alerts you if any problem occurs in the EventTracker.
Diagnostics data includes Product Information, System Information, License Information, Update Information, Service Status, Database, and Archive Status, configuration files, log dumps and SQL Log status. It is further extended to set debug levels and mask sensitive information. You can also back-up and restore files, generate alerts if CAB’s are not received from Collection Point to Collection Master for last 24 hrs.
1. Click the Start button, select All Programs, and then select Prism Microsystems.
2. Select EventTracker, select EventTracker Control Panel, and then select Diagnostics icon.
EventTracker displays EventTracker Diagnostics window.
3. Right-click the Diagnostics Tool icon ![]() on the taskbar.
on the taskbar.
EventTracker displays the shortcut menu.
4. To set the frequency, move the mouse pointer over the Run Frequency option. EventTracker displays the options to set the frequency.
If there is any error, then Diagnostics Tool displays the diagnostics message balloon to grab your attention.
This option helps to set log severity levels for EventTracker modules.
1 Launch EventTracker Control Panel, click Diagnostics, and then click Debug button.
Diagnostics Tool displays the Debug Levels window.
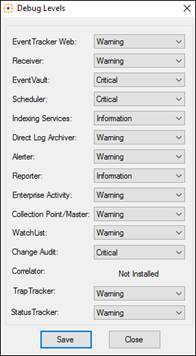
EventTracker writes the log messages in the respective log files with the severity levels set.
|
EventTracker Module |
Log File |
Folder Path |
|
EventTracker Web |
*.* |
…\Program Files\Prism Microsystems\EventTrackerWeb\Logs |
|
EventTracker Web |
EventTracker.log |
…\Program Files\Prism Microsystems\EventTracker\Logs |
|
Receiver |
evtrxer*.txt Ex: evtrxlog-514.txt evtrxlog-14505.txt evtrxlog-14509.txt |
…\Program Files\Prism Microsystems\EventTracker\Logs |
|
EventVault |
evtarlog.txt |
…\Program Files\Prism Microsystems\EventTracker |
|
Scheduler |
etslog.txt |
…\Program Files\Prism Microsystems\EventTracker |
|
Indexing Services |
Prism.Keyword.Indexer.*.log |
…\Program Files\Prism Microsystems\EventTracker\Logs |
|
Direct Log Archiver |
LogFileParser.txt |
…\Program Files\Prism Microsystems\EventTracker\Logs |
|
Alerter |
ETRSSLog.txt |
…\Program Files\Prism Microsystems\EventTracker |
|
Reporter |
Prism.EventTracker.Report*.log |
…\Program Files\Prism Microsystems\EventTracker\AdvancedReports\Logs |
|
Enterprise Activity |
etuserlog.txt |
…\Program Files\Prism Microsystems\EventTracker\Logs |
|
Collection Point/Master |
evtCPlog.txt |
…\Program Files\Prism Microsystems\EventTracker |
|
Change Audit |
*.* |
…\Program Files\Prism Microsystems\WCWindows\Logs |
|
Correlator |
etcorlog.txt |
…\Program Files\Prism Microsystems\EventTracker\ETCorrel |
|
TrapTracker |
evtrxlog.txt |
…\Program Files\Prism Microsystems\TrapTracker |
3 Select appropriately in the relevant fields.
4 Select Save.
This option helps to mask classified information in log files when you send the log files outside your enterprise for debugging.
1 To obfuscate classified information, launch EventTracker Control Panel.
2 Click Diagnostics, and then click the Obfuscate Output checkbox.
Diagnostics Tool displays Masking Configuration window.
3 Move the mouse pointer over the Help hyperlink to view help tips. Select the appropriate checkbox.
4 Click Save and then click the OK button.
Diagnostics Tool enables the Edit Configuration button.
5 Click E-mail to send log files and configuration files for debugging.
Diagnostics Tool displays the message box indicating to Limit CAB file details and/or Include XML files.
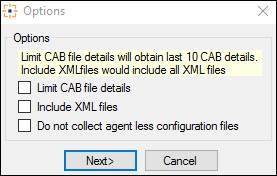
6 Click Next>.
Diagnostics Tool displays the EventTracker Diagnostics window with more mailing options.
7 Enter/select appropriate data in the relevant fields.
8 Click Send.
EventTracker Diagnostic window displays message.
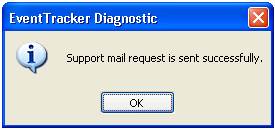
You can also save the log files and configuration files as a compressed file for future reference.
9 Click Save on the EventTracker Diagnostics window.
10 Type the problem description in the provided field.
11 Click Save.
When you access EventTracker from a remote location using a browser client, Diagnostics tool displays a warning message alert indicator and prompts you to respond if any problem occurs with EventTracker.
Diagnostics tool displays and hides the indicator based on the diagnostic frequency you set. By default, diagnostic frequency is set to 24 hours.
An admin user can view incident and problem descriptions. A normal user is only indicated that a problem has occurred.
1 Log on to EventTracker with admin user credentials.
Diagnostics tool displays the diagnostic alert indicator.
2 Click  icon.
icon.
EventTracker displays the File Download pop-up window to open or save the diagnostic report.
3 Click Open to view the report.
EventTracker opens the report in the Notepad.
This option provides the status and size of SQL logs. You can purge SQL transaction logs at any time. It also alerts when the size of SQL logs exceeds the threshold value.
1 Open EventTracker Control Panel, click Diagnostics, and then click the SQL Log button.
SQL Log Status window displays.
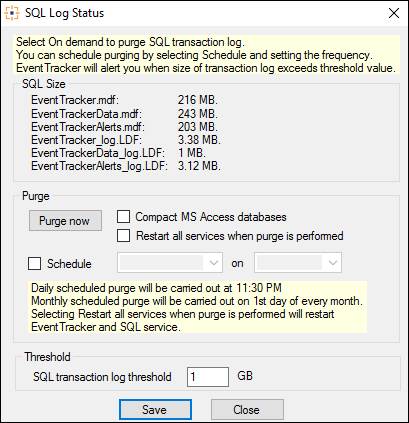
2 To purge data immediately, select the Purge now button.
(OR)
Select Schedule option, and then select Hourly/Daily/Weekly/Monthly from drop down.
3 Enter the SQL transaction log threshold value (in GB), and then select the Save button.
This option helps to take a back up of the files when required.
1 Open EventTracker Control Panel, click Diagnostics, and then click the Backup Configuration button.
Backup & Restore window displays.
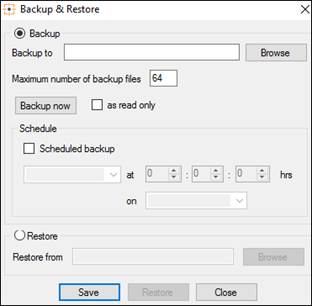
2 To backup data, select the Browse button and select the required location.
Browse For Folder window displays.
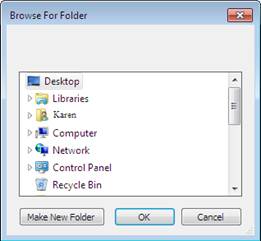
3 Select the required location and then select the OK button.
4 To backup data immediately, click the Backup now button.
(OR)
To schedule a backup, select Scheduled backup option. Enter the date and time.
5 Select the Save button.
The file is saved in .bkp format in the respective location.
This option helps to restore the files when required.
1 Open EventTracker Control Panel, click Diagnostics, and then click the Backup Configuration button.
Backup & Restore window displays.
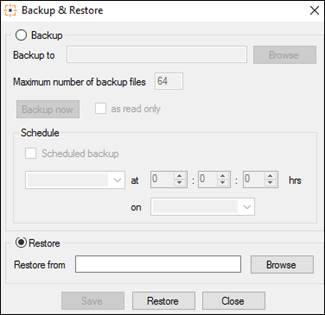
2 Select Restore option, and then select the Browse button.
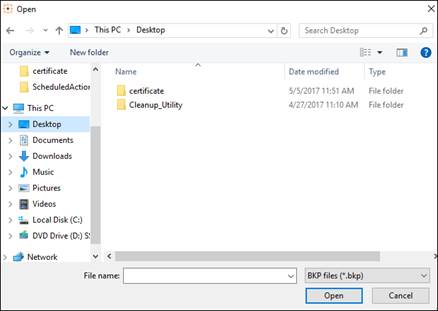
3 Select the location of the file (i.e. *.bkp file) to restore and then select the Open button.
4 Select the Restore button.
If a Collection Point has been configured and no CAB files have been received for a specified duration, then an alert can be generated.
1 Open EventTracker Control Panel, click Diagnostics, and then click the Advanced button.
Advanced Settings window display:
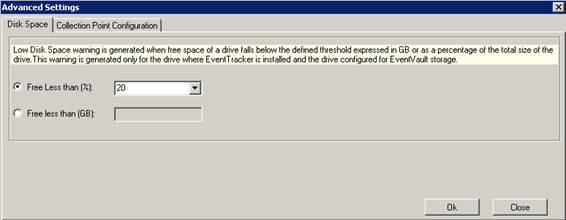
2. Enter the Free disk Space as per your requirement by selecting from the dropdown list and clickOK.
3. In the Collection Point Configuration pane, view the details of CPs configured for the CM.
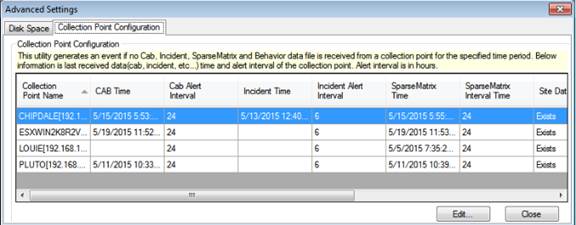
NOTE: For Standard console Type; The Collection Point Configuration pane will not be available.
4. In Collection Point Configuration pane, click the Edit… button.
Collection Point Configurations window displays.
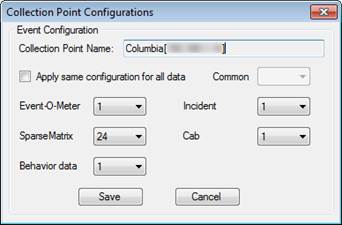
5. To specify different time interval, select the respective Event-O-Meter, SparseMatrix, Behavior data, Incident, Cab drop down and select the duration.
6. To select a common time interval, select Apply same configuration for all data option, select Common drop down, and then select duration (in hours).
7. Select the Save button.
If Collection Master should not collect agent less configuration files, then select the option not to collect agent less configuration files.
1. Select the Save button.

2. Select Do not collect agent less configuration files option, and then select the Next> button.
3. Enter the description, and then select the Save button.
If the respective alert is triggered, then a notification is displayed in EventTracker Diagnostics Status pane. Please refer the figure below.

To save the Diagnostics status,
· Click the View Full Status button.
The Status Page gets displayed.

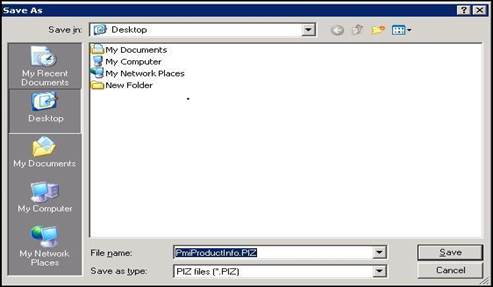
· Click the Save button and save the diagnostics in your system with a file name as shown in the figure below: