
After EventTracker is deployed on numerous systems in a large Network it is very likely that you notice EventTracker receiving millions of events. Actually a majority of these events would be of little use to you. Using appropriate priority you can filter out unnecessary events to improve utility. `Filtering unnecessary events’ is a powerful feature based on priority configured by you.
Traffic Analyzer is a tool that is part of the EventTracker. It helps to find the details of the most common events and to set your order of priority. Accordingly create filters for non-essential events that are just increasing traffic but have little value.
Filtering is a continuous process. Priority may vary from one system to another. Over a period of time, with your experience, priority events can be separated from non-priority events in a specific system. Repeating this process every week enables you to receive only events of value in optimizing your operations. When non-priority events are filtered out, EventTracker functions optimally.
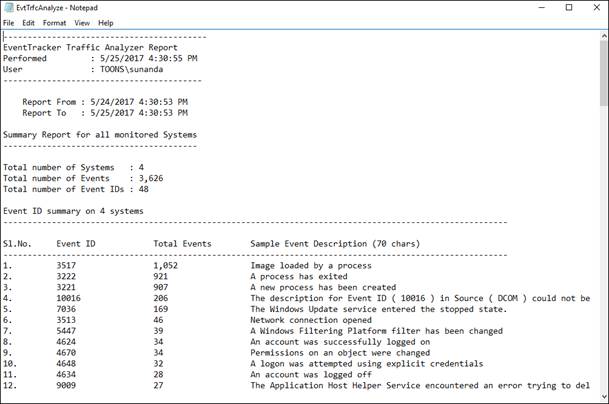
This report provides total counts per system for each event id. Filter and display event count details based on user-defined criteria.
Usage: Analyze Windows specific security events, correlate events, broad searches per criteria with subsequent sorting and ordering of the result set.
1 Double-click Traffic Analyzer on the EventTracker Control Panel.
Traffic Analyzer window displays.
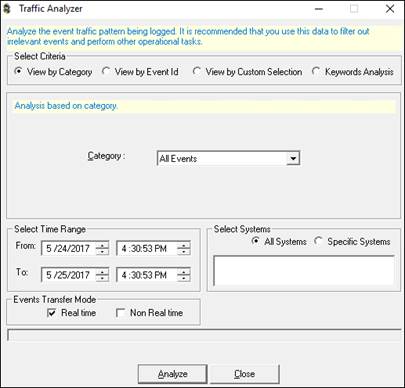
This option helps you analyze events based on Category.
1 Select the View by Category option, if not selected.
2 Select a Category from the Category drop-down list.
Example: All Error Events.
3 Set the Select Time Range in From, To drop-down list.
4 Select the All Systems option to select all monitored systems.
(OR)
Select the Specific Systems option.
Type the name of the systems separated by comma in the text box provided.
5 Click Analyze.
Traffic Analyzer displays the report in the Notepad.
This option helps you analyze hard coded Windows specific security events.
1 To analyze event traffic by event ID, Select the View by Event Id option.
|
Field |
Description |
|
Display all records: By default, this option is selected. All records will be displayed in report in descending order. |
|
|
Display only top: Select this option if you want only a specified number of records to be displayed in the report. |
|
|
Select Event Id: Select 5 hard coded Windows security events for event traffic analysis. |
|
|
540 Successful Network Logon |
Selecting this id will generate 2 reports sorted by Username and IP address. |
|
672 Authentication Ticket Granted |
Selecting this id will generate 2 reports sorted by Username and IP address. |
|
673 Service Ticket Granted |
Selecting this id will generate 1 report sorted by IP Address. |
|
675 Pre-authentication failed |
Selecting this id will generate 2 reports sorted by Username and IP address. |
|
680 Logon attempt |
Selecting this id will generate 2 reports sorted by Username and Computer. |
2 Type / select appropriate data in the relevant fields.
3 Select the All Systems option to select all monitored systems.
(OR)
Select the Specific Systems option.
Type the name of the systems separated by comma in the text box provided.
4 Select Analyze.
Traffic Analyzer displays the report in the Notepad.
If you wish to display only a specified number of records in the report, type the number of records in the Display only top field or click the spin box.
This option helps you customize the selection criteria.
1 Select the View by Custom Selection option

2 Enter appropriate values in the relevant fields.
3 Select the All Systems option to select all monitored systems.
(OR)
Select the Specific Systems option.
Type the name of the systems separated by comma in the text box provided.
4 Click Analyze.
Traffic Analyzer displays the report in the Notepad.
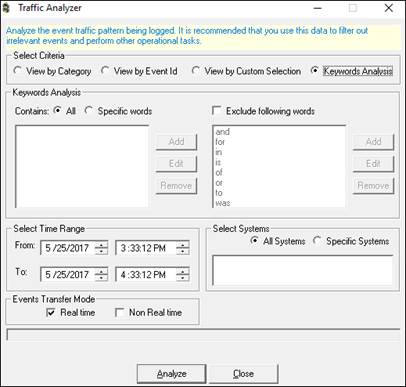
This option helps to analyze traffic by keywords.
1 Select the Keywords Analysis option.
|
Field |
Description |
|
Keywords Analysis: Helps to analyze events by keywords. |
|
|
Contains All |
Analyze logs that contain all keywords. |
|
Contains Specific words |
Analyze logs that contain specific keywords. |
|
Excluding following words |
Select this checkbox to exclude commonly occurring words. |
2 Type appropriately in the relevant fields.
3 Select the All Systems option to select all monitored systems.
(OR)
Select the Specific Systems option.
Type the name of the systems separated by comma in the text box provided.
4 Click Analyze.
EventTracker displays the report in the Notepad.
This option helps to add keywords.
1 Select the Specific words option.
Traffic Analyzer enables the Add, Edit, and Remove buttons.
2 Click Add.
Traffic Analyzer displays the Traffic Analyzer dialog box.

3 Type the keyword in the text box provided.
Example: ETAdmin
4 Click OK.
Traffic Analyzer adds the keyword to the list of keywords.
5 To analyze logs that contain a specific keyword, select a keyword from the list and then click Analyze.
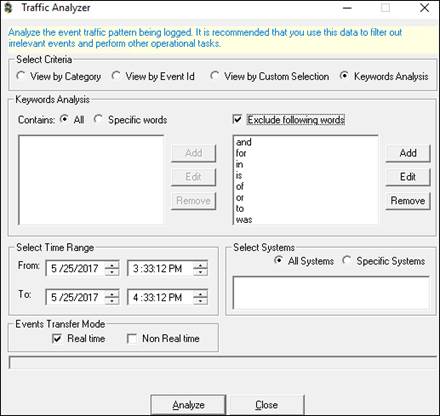
This option helps to add most commonly occurring words to exclude from analysis.
1 Select the Exclude following words option.
Traffic Analyzer displays the list of commonly occurring words, enables Add, Edit, and Remote buttons.
2 Click Add.
Traffic Analyzer displays the Traffic Analyzer dialog box.
3 Type the keyword in the text box provided.
4 Click OK.
Traffic Analyzer adds the new keyword to the list for exclusion.