EventTracker generates an alert when a critical event occurs, such as security breaches, performance problems, etc. Configure an unlimited number of rule-based alerts with customizable event criteria including support for event-fired automatic (custom) actions for any defined event.
Ø Out of the Box alerts for the most common predefined alert condition
Ø Ability to create your own alert conditions
Ø Reliable framework for alerts
Ø Ability to minimize false positive
Ø Firing automatic actions as a receipt of event can increase system’s availability
EventTracker ‘Risk Metrics’ considers three factors to calculate Risk (R). This calculation will be performed just before an alert is raised. Alert notification is sent only when the risk is greater than or equal to the threshold.
|
Risk |
|
|
T |
Threat level (how severe the Alert is) assigned while creating Alerts. |
|
A |
Asset value of the system (how important or critical the computer is) set through the System Manager. |
|
V |
Vulnerability (how vulnerable the computer is) automatically updated using third party vulnerability assessment reports. |
Example #1:
Day 1
Ø System Type: Server
Ø Threat level: Medium
Ø Asset value: Medium
Ø Vulnerability: High
Ø Alert notification is sent since it is found to be highly vulnerable by running the vulnerability scanner.
Example #2:
Day 2
Ø System Type: Server
Ø Threat level: Medium
Ø Asset value: Medium
Ø Vulnerability: Low (system is hardened by applying hotfixes, patches, & service packs)
Ø Alert notification is not sent since it is found to be not vulnerable by running the vulnerability scanner.
The Alert Email Template feature will now allow the user to extract the value from the event and prepare Alert description format based on selected email Template. The user will have an option to select the email template for the alert email.
To make the email more precise the user is allowed to customize the alert email using short description with plan text/HTML format as per their requirement.
The user(s) can configure alerts by extracting the values from the event and compare it against the Active Watch List. If the admin maintains a local black/white list data, he/she can configure the alerts and compare it with Active Watch list, based on which the alert will be triggered.
· Go to Admin-> Alerts. In the Alert Management page, click the Add Alert icon.
· Enter the Alert name and the other required fields.
NOTE: Follow the steps in the document “BDS Alert Configuration” for extracting values.
In the below example, we have taken the extraction method as “Regular Expression” for Alert “Critical Potential Breach from low reputation IP”.
· Configure the alert using Event level configuration or Alert level configuration.
· Go to Admin-> Alerts. In the Alert Management page, click the Add Alert icon.
· Enter the Alert name and the other required fields.
In the below example, we have taken the extraction method as “Regular Expression” for Alert “EventTracker: Critical Potential Breach from low reputation IP”.
· Configure the alert using Event level configuration or Alert level configuration.
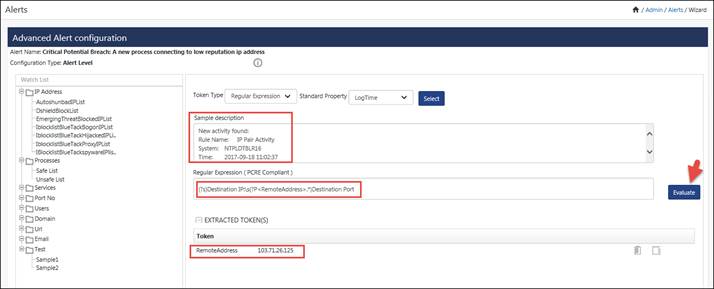
· Select the Token Type as Regular Expression.
· Enter the Sample Description, Regular Expression and a Short Description.
Here we have extracted the value “RemoteAddress”.
The extracted values will be displayed in the Watch List Lookup pane.
· Click the lookup icon ![]() to add data class and watch list.
to add data class and watch list.
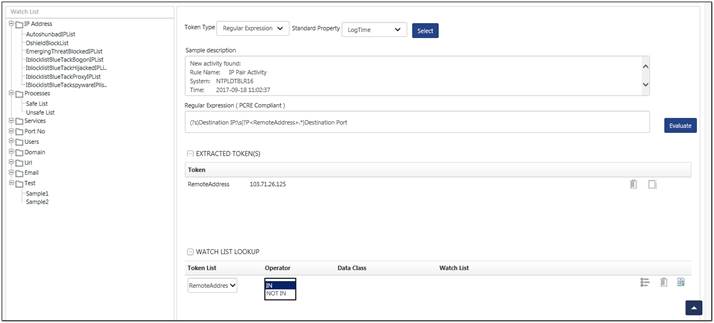
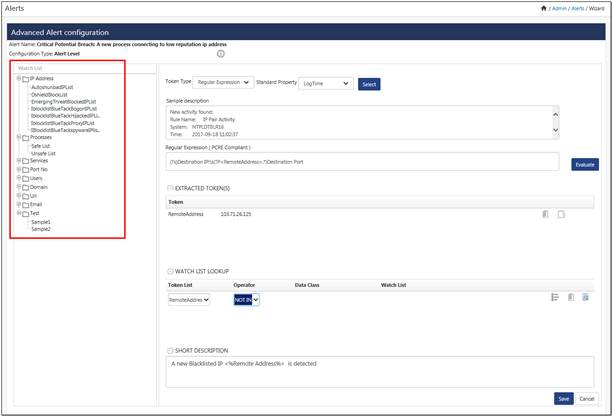
From the Watch List tree, select the class or group to add to the watch list.
The user can also select Operator as IN or NOT IN as per the user preference.
To add multiple lookup for the extracted token, click the clone icon![]() , to duplicate the record. Now the user can change the duplicated records as per requirement.
, to duplicate the record. Now the user can change the duplicated records as per requirement.
For example, we have taken the extracted token “RemoteAddress” and added the watch list “Safe List” by selecting it from the watch list tree.
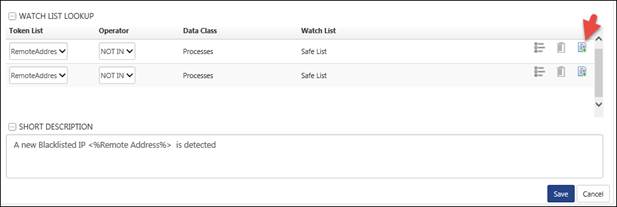
· To save the configuration, click Save and Finish.
This option enables you to configure alert, add events to alert, and configure alert actions.
1 To add custom alerts, click Admin, and then click Alerts.
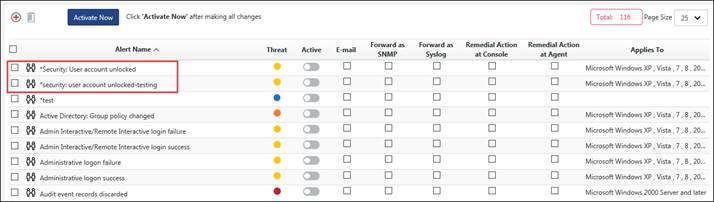
EventTracker displays Alert Management page.

|
Field |
Description |
|
Search |
Type the search string and then click search icon This helps to easily locate the alert you are looking for. |
|
Search by |
Search the alert by Alert Name/Event id/description option. |
|
Page Size |
Select an option from this drop-down list to display the maximum number of alerts in a page. |
|
Alert Name |
Name of the alert. Click the hyperlink to modify alert details. |
|
Threat level |
Severity of the alert. |
|
Active |
Select or clear the checkbox to activate or deactivate the alert. |
|
|
Select this checkbox to configure e-mail alert notification. The SMTP server should be configured to send Email. |
|
Message |
Select this checkbox to configure console message alert notification. |
|
Forward as SNMP |
Select this checkbox to forward alert notification as an SNMP trap. |
|
Forward as SYSLOG |
Select this checkbox to forward alert notification as a SYSLOG message. |
|
Remedial Action at Console |
Select this checkbox to configure custom action to be executed on receipt of an event at the manager side. |
|
Remedial Action at Agent |
Select this checkbox to configure custom action to be executed on receipt of an event at the agent side. You execute these actions only on Windows systems where agents are deployed. You cannot execute these actions on NIX systems where agent less monitoring is deployed. |
|
Activate Now |
Click to activate the selected alert. |
|
Add alert |
Click to add custom alert. |
|
Delete |
Select the checkbox against the alert that you want to delete, and then click Delete. Select the checkbox adjacent to the “Alert Name” column to select all Alerts. |
2 On the Alert Management page, click the ![]() icon to add new alert.
icon to add new alert.
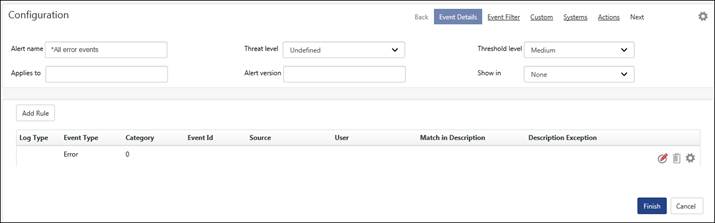
EventTracker displays the Alert configuration page.

(OR)
Click the name of the alert that you wish to modify.
EventTracker displays the Alert configuration page.
|
Fields |
Description |
|
Threat level |
Select severity of the alert. |
|
Threshold level |
Alert notification is sent when the risk is greater or equal to the threshold. |
|
Show in |
Select ‘Compliance Dashboard’ from dropdown to view the selected alert details in the compliance dashboard. |
|
Alert Version |
Representation of the version based on alerts, where the default alert version is 1.0. |
|
Applies to |
Select the application or server for which the alert has to be generated. |
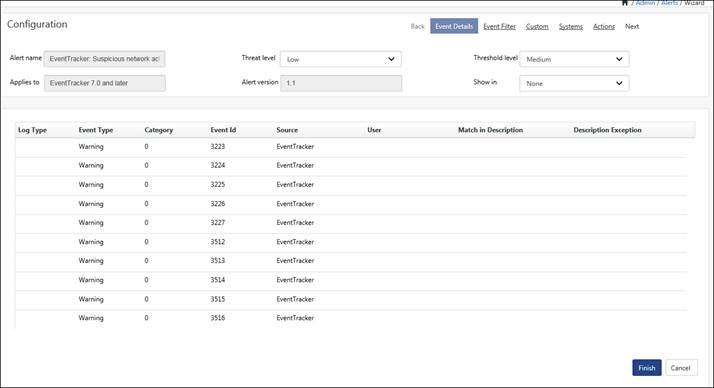
3 Type the new alert name in the Alert Name field.
Example - EventTracker: Suspicious Network Activity.
4 Select the severity of threat from the Threat level drop-down list.
5 Select the threshold from the Threshold level drop-down list.
6 To view the alert in compliance dashboard then in ‘Show in’ dropdown, select ‘Compliance Dashboard’.
7 To add the version to an alert, select Alert Version and enter the version.
8 Add the products for which the alert needs to be generated in the Applies to box.
9 Click the Add button to add event details.
EventTracker displays the Add Event Rule dialog box.

|
2 NOTE |
|
User will not have an option to edit the Pre-Defined Alert Rule. |
|
Field |
Description |
|
Log Type |
It describes the type of log to be monitored. |
|
Event Type |
Classification of event severity: Error, Information, Warning in the System and Application logs; Audit Success or Audit Failure in the Security log. Select an event type from the drop-down list. |
|
Category |
Classification of the event by the event source. This information is primarily used in the security log. For example, for security audits, this corresponds to one of the event types for which success or failure auditing can be enabled in Group Policy. Type the category number in this field. This field supports numeric data type only. |
|
User |
Type the name of the user. |
|
Event Id |
A number identifying a particular event. The first line of the description usually contains the name of the event type. For example, 6005 is the ID of the event that occurs when the Event log service is started. The first line of the description of such an event is "The Event log service was started." The Event ID and the Source can be used by product support representatives to troubleshoot system problems. Type the event ID number in this field. This field supports numeric data type only. |
|
Source |
The software that logged the event, which can be either a program name such as "SQL Server," or a component of the system or of a large program such as a driver name. For example, "Elnkii" indicates an EtherLink II driver. Type the source in this field. |
|
Match in Description |
Type a sub-string of the description that needs to be matched. EventTracker supports multiple strings separated by the following operands. && stands for AND condition. II stands for OR condition. If you type Successful Logon && New Trusted Domain II Removing Trusted Domain, EventTracker will filter out the events that are matching Successful Logon, (AND) New Trusted Domain (OR) Removing Trusted Domain. |
|
Description exception |
Type a sub-string of the description that needs to be exempted. |
|
Event Type |
Description |
|
Error |
A significant problem, such as loss of data or loss of functionality. For example, if a service fails to load during startup, an Error will be logged. |
|
Warning |
An event that is not necessarily significant, but may indicate a possible future problem. For example, when disk space is low, a Warning will be logged. |
|
Information |
In event that describes the successful operation of an application, driver, or service. For example, when a network driver loads successfully, an Information event will be logged. |
|
Audit Success |
An audited security access attempt that succeeds. For example, a user's successful attempt to log on the system will be logged as a Success Audit event. |
|
Audit Failure |
An audited security access attempt that fails. For example, if a user tries to access a network drive and fails, the attempt will be logged as a Failure Audit event. |
|
Verbose |
A Verbose event is a debugging trace. (Applies only to Vista) |
|
Critical |
A critical event is a fatal error or application crash. (Applies only to Vista) |
10 Enter the required fields, and then click Add.
11 Click Event Filter hyperlink (OR) click![]() .
.
EventTracker displays the Event Filter page.
12 Click Add to add event details for the event filter.
13 Enter the required fields, and then click Add.
14 Click Custom hyperlink (OR) click![]() .
.
EventTracker displays the Custom page.

|
Field |
Description |
|
Apply All Time |
If selected, alerts actions are executed for events occurred all through the day (24 hours). |
|
Apply between these time |
If selected, alerts actions are executed for events occurred during the specified time frame. |
|
Alert based on Count |
This option lets you to receive alert notification only when the same event occurs for the specified number of times within the specified duration. Check the Enable option, to provide the event count and duration. |
|
Archive Alert
|
Select the Store this alert in Alert Archives option to store the alert in the ‘Alerts Archives’. Archived alerts will be used for the alert analysis. |
15 Select Apply All Time option.
(OR)
Select the Apply between this time option, and then select From and To time from the calendar control.
16 In Alert based on count pane, check the Enable option, provide the number of event count in the Raise alert for event count field, and then provide the time in seconds in the Duration field.
|
2 NOTE |
|
The default value for Raise alert for event count is 2 and Duration is 3600 in seconds. |
17 Click Systems (OR) click![]() .
.
EventTracker displays the Systems page.
By default, EventTracker selects the All Systems checkbox to apply the Alert to all monitored groups/systems. Clear this checkbox to select groups/systems.
18 Select the Groups / Systems / All Systems for which the alert is to be monitored.
|
2 NOTE |
|
We have now provided an interface to configure alert based on the asset value of system. |
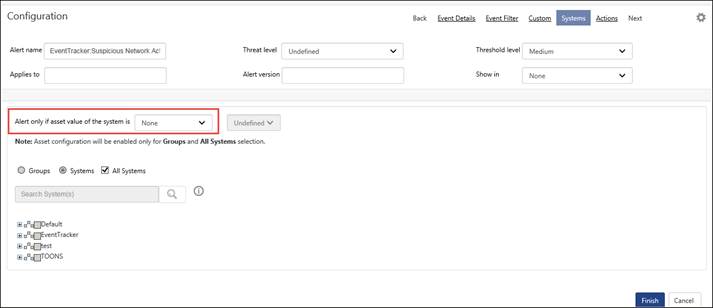
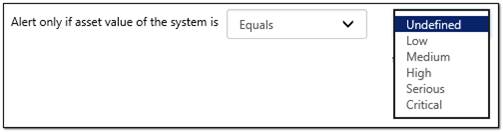
19 The new field “Alert only if asset value of the system is” is where the user can select the operator and the asset value from the dropdown list.
20 Select the Operator (Equals/Less than equal/Greater than equal).
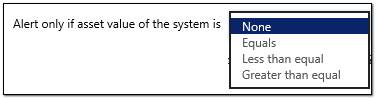
21 Select the Asset Value.
22 Click Actions hyperlink (OR) click![]() .
.
EventTracker displays the Actions page.
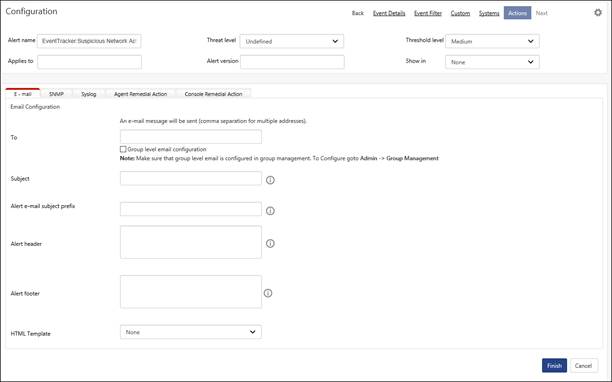
20 In the e-mail configuration tab, enter the recipient address, subject, alert footer and alert e-mail subject prefix, as per the requirement.
21 Enter multiline header/footer, for configuring an email alert action.
|
2 NOTE |
|
To configure an alert, action is not mandatory. Alert actions can be configured at any point of time. |
22 Select and configure the type of action from the respective tabs (i.e. E-mail, SNMP, syslog, Agent Remedial Action, Console Remedial Action).
23 Click Finish.
EventTracker adds the newly created alert and displays it on the Alert Management page.
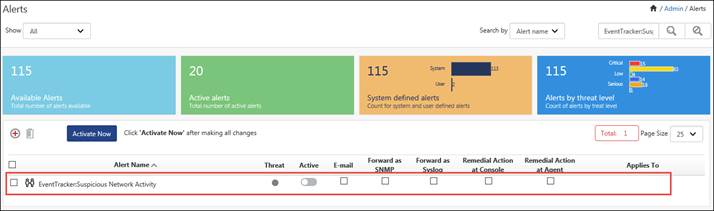
24 To activate the newly added alert, select the checkbox under Active column.
EventTracker displays the success message pop-up window. EventTracker saves the alert configuration.
|
2 NOTE |
|
The configured alert details can be modified/edited at any point of time. On the Alert Management page, click the alert name that is to be modified/edited. Make the necessary changes in Alert Configuration page, and then click the Finish button to save the changes.
|
1. To make a copy of existing alert, select Copy ![]() icon.
icon.
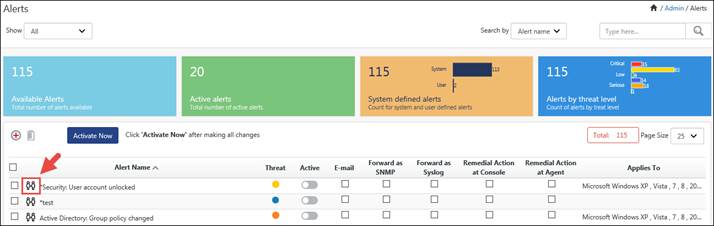
Alert Configuration page displays.
2. Enter Alert Version:, Applies To: fields.

3. If required, edit/enter rest of the information, and then select the Save As button.
A copy of the existing alert is created.
Click the Activate Now button.
This option helps to add pre-defined categories as alerts.
1) To add pre defined categories as alerts, click the Admin, and then click Category.
EventTracker displays the Category Management page.
2) Right-click the category that you wish to add as an alert. From the shortcut menu, select Add as Alert.
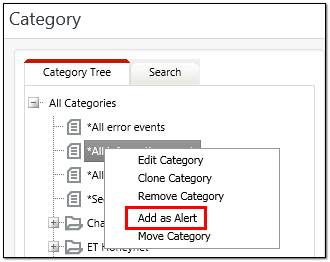
EventTracker displays the Alert Management -> Event Details page.
3) Complete the alert configuration process as described in Add Custom Alerts.
This option enables you to delete Alerts.
1 On the Alert Management page, select the alert to be deleted.
2 Click the Delete button.
This option enables you to configure alert actions that are to be executed at the EventTracker manager system.
1 Configure an alert as explained in the Add Custom Alerts.
2 Click an appropriate tab to configure alert actions.
|
2 NOTE |
|
You have the liberty to set more than one alert action. You can also associate an alert action with pre-defined alerts by selecting appropriate checkboxes on the Alert Management page. |
This option enables you to configure an E-mail(s) to send as an alert action.
1 On the Alert configuration page, click Actions hyperlink, and then click the E – mail tab.
(OR)
On the Alert Management page, click the checkbox under E-mail column.
EventTracker displays the Email dialog box.
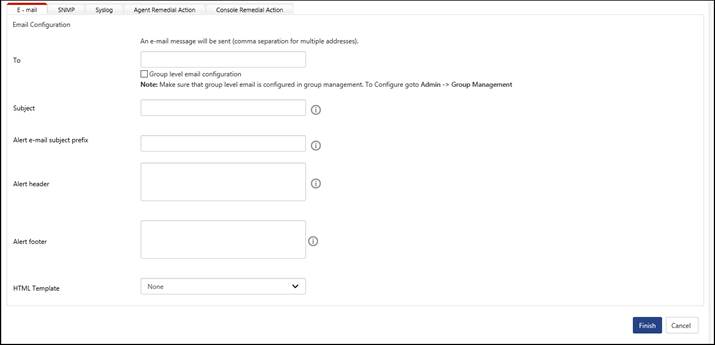
2 Enter required details.
3 On the Alert Configuration page, click the Finish button to save the alert action.
(OR)
In the Email dialog box, click OK.
4 On the Alert Management page, click the checkbox under Active column, and then click the Activate Now button to activate the alert action.
FAQ: I setup an email alert and it is not working. What should I do?
Please crosscheck the following.
n The SMTP server mentioned must be accessible from the Console system. That is either the system must be able to access Internet or the SMTP server must be reachable over the LAN.
n Ensure valid email addresses are provided in both "To Address" and "From Address".
n In case you have not configured Email, then Manager -> Email Configuration.
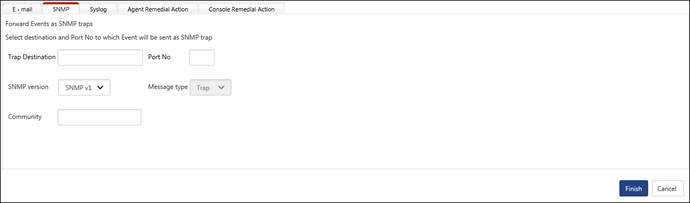
All incoming events are compared with the configured alert. Whenever there is a match between an event and the alert criteria, a copy of the event is forwarded as an SNMP trap to the specified destination.
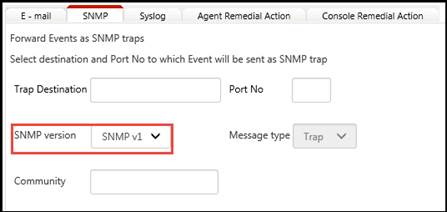
1 On the Alert configuration page, click Actions hyperlink, and then click the SNMP tab.
(OR)
On the Alert Management page, click the checkbox under Forward as SNMP column.
EventTracker displays the SNMP dialog box.
|
Field |
Description |
|
Trap Destination |
Type the IP address or host name. |
|
Port No |
Type the port number in this field i.e. 162.This field supports numeric data type only. |
|
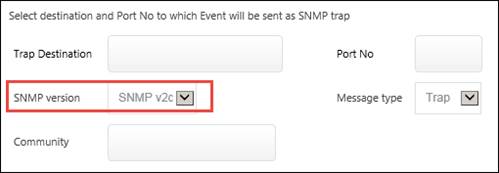
SNMP version |
3 types of SNMP versions used are
|
|
Message Type |
Trap. Inform – Trap with an acknowledgement |
|
Community |
Authentication key for encryption and decryption |
|
Field |
Description |
|
SNMP v1 |
|
|
SNMP v2c |
|
|
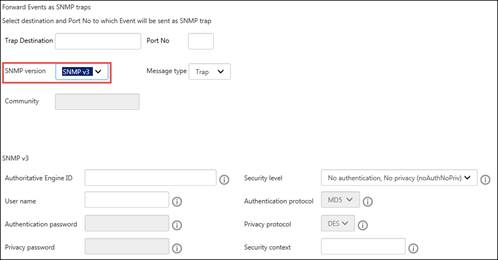
SNMP v3 |
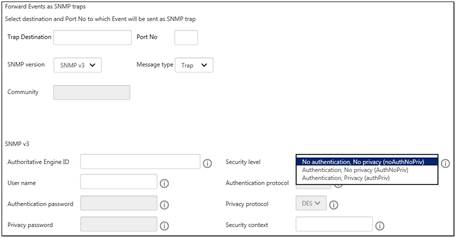
By default, No authentication, No privacy is selected.
|
|
Security level |
There 3 different security levels been provided No authentication, No privacy (noAuthNoPriv) – Refer picture above. Authentication, No Privacy (AuthNoPriv)- Refer picture below. Authentication and Privacy (authPriv)- Refer picture below.
|
|
User name |
A string representing the name of the user. |
|
Authentication Protocol |
An indication of whether messages sent on behalf of this user can be authenticated, and if so, the type of authentication protocol which is used.
Two such protocols are defined:
MD5 SHA1
The above option is enabled only if the following security levels are selected.
Authentication, No Privacy (AuthNoPriv) Authentication and Privacy (authPriv) |
|
Authentication password |
If messages sent on behalf of this user can be authenticated, the (private) authentication password for use with the authentication protocol. Note that a user’s authentication key will normally be different at different authoritative SNMP engines. The Authentication password is not accessible via SNMP. The length requirements of the Authentication password are defined by the Authentication Protocol in use. |
|
Privacy Protocol |
An indication of whether messages sent on behalf of this user can be protected from disclosure, and if so, the type of privacy protocol which is used. One such protocol is defined in this memo: the CBC-DES Symmetric Encryption Protocol. |
|
Privacy password |
If messages sent on behalf of this user can be en/decrypted, the (private) privacy password for use with the privacy protocol. Note that a user’s privacy password will normally be different at different authoritative SNMP engines. The Privacy Password is not accessible via SNMP. The length requirements of the Privacy Password are defined by the Privacy Protocol in use. |
|
Security context |
A human-readable string representing the user in a format that is Security Model independent. There is a one-to-one relationship between Username and Security Context. |
2 Type appropriately in the relevant fields.
3 On the Alert Configuration page, click the Finish button to save the alert action.
(OR)
In the SNMP dialog box, click OK.
4 On the Alert Management page, click the checkbox under Active column, and then click the Activate Now button to activate the alert action.
|
2 NOTE |
|
The Threat Level and Threshold Level in Event Details page should be Undefined otherwise traps will not be received in Trap Tracker Console. For detail information, refer Trap Tracker. |
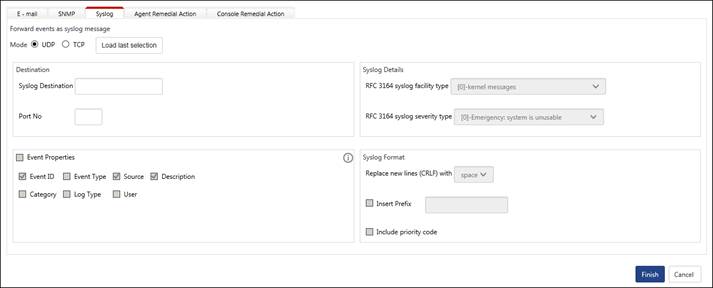
All incoming events are compared with the configured alert. Whenever there is a match between an event and the alert criteria, a copy of the event is forwarded as a syslog message to the specified destination.
1 On the Alert configuration page, click Actions hyperlink, and then click the syslog tab.
(OR)
On the Alert Management page, select the checkbox under Forward as syslog.
EventTracker displays the syslog dialog box.
|
Field |
Description |
|
Mode |
Select either TCP or UDP as the transport protocol mode. |
|
Load last selection |
Click to load the last saved configuration of a syslog message. |
|
Destination |
|
|
syslog Destination |
Type the IP address or host name. |
|
Port No |
Type the port number corresponding to the transport mode selected. |
|
syslog Details |
|
|
RFC 3164 syslog facility type |
Return facility value from a received and processed syslog message. This is the text representation of the facility. |
|
RFC 3164 syslog severity type |
Return severity value from a received and processed syslog message. This is the text representation of the severity. |
|
Event Properties |
Select the event properties to be included in the description of the syslog message. EventTracker by default selects Event ID, Source, and Description options. You can select properties as per your choice. |
|
syslog Format |
|
|
Replace new lines (CRLF) with |
Replaces the newline characters in the syslog message with tab or space. |
|
Insert prefix |
Check Insert Prefix option and then provide the prefix. The system messages sent to the syslog device inserts this prefix to all the messages it intercepts on their way to the message file. |
|
Include priority code |
Each syslog message is one line. A message can contain a priority code, marked by a digit enclosed in < > (angle braces) at the beginning of the line. The priority code represents both the Facility and Severity of the message. |
2 Select/enter appropriately in the relevant fields.
3 Click OK.
This option enables you to configure custom action to be executed on receipt of an event at the manager system.
1 On the Alert configuration page, click Actions hyperlink, and then click the Console Remedial Action tab.
OR
On the Alert Management page, click the checkbox under Remedial Action at Console column.
EventTracker displays the Console dialog box.
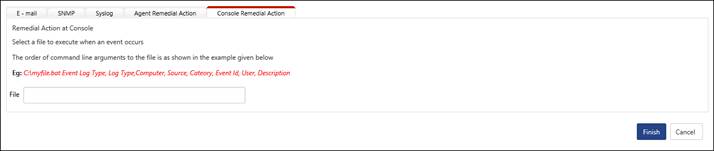
2 Type the path of the custom action file in the File field.
3 Click OK.
|
2 NOTE |
|
a) To enable remedial action at manager console, click Admin drop-down, select Manager. b) Select Enable Remedial Action option and then click the Save button. |
Though EventTracker is shipped with predefined alerts that are applicable to all monitored systems irrespective of O/S and mode of monitoring (Agent based or Agent less), to get alert notification messages you need to explicitly configure alert actions. While configuring alert actions it is left to your discretion to include and exclude systems. Same rule holds good for user-defined alerts.
|
2 NOTE |
|
Remedial actions can be executed only on systems where EventTracker agent has been deployed. |
Excluding systems for alert actions doesn’t mean that you are excluding them from monitoring. EventTracker logs all events that occur in monitored systems into the database, you can plow through the data by performing Log Search.
So, utilize this feature judiciously to draw maximum benefits.
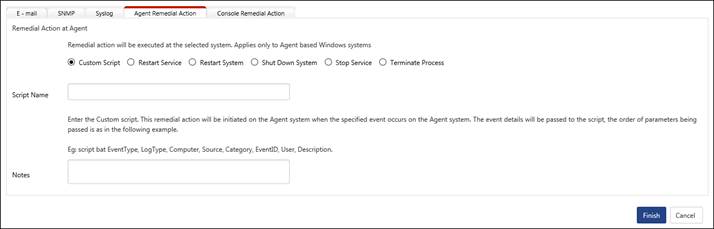
To execute remedial action at the agent system,
1 On the Alert configuration page, click Actions hyperlink, and then click the Agent Remedial Action tab.
OR
On the Alert Management page, click the checkbox under Remedial Action at Agent column.
EventTracker displays the Agent dialog box.
|
Field |
Description |
|
Custom Script |
Type the name of the script in Script Name field. Script files are stored in the default EventTracker Agent installation path typically …\Program Files\Prism Microsystems\EventTracker\Agent |
|
Restart Service |
Type the name of the service that you want to restart in Service Name field. |
|
Restart System |
This option will restart the agent system on the occurrence of the configured EventID. |
|
Shut Down System |
This option will shut down the agent system on the occurrence of configured EventID. |
|
Stop Service |
Type the name of the service that you want to stop in Service Name field. |
|
Terminate Process |
You can configure this action only for events 3217, 3218, 3221, 3223, and 3226. |
2 Select an appropriate remedial action option.
3 Type appropriate description in the Notes field for future reference.
4 Click Ok.
|
2 NOTE |
|
To enable remedial action at agent side refer EventTracker Control Panel -> Agent Configuration. |
This option enables you to edit the alert actions.
1 On the Alert Management page, click the Alert Name for which you wish to edit the alert actions.
2 On the Alert configuration page, click Actions hyperlink.
3 Click appropriate tab(s) to edit the alert action(s).
4 Click the Finish button to save the changes.
5 On the Alert Management page, click the checkbox under Active column, and then click the Activate Now button to activate the alert action.
A message from webpage displays.