Note: To understand the usage of the new system selection interface introduced in feature update 9.3.3 as part of update ET93U20-031, please refer to New System Selection Interface User Guide.
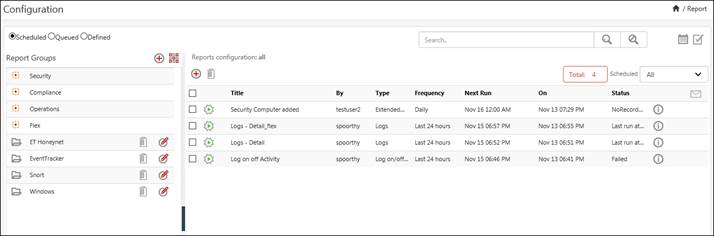
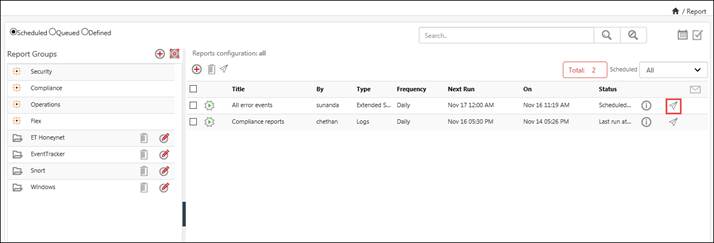
This gives a status view of all the reports that have been generated via Scheduled/Queued/Defined.
1. Select Scheduled/Queued/Defined
option to generate the respective reports and then click the New ![]() button.
button.
2. To view the respective Security/Operation/Compliance/Flex Reports that are configured, click the respective Report groups.
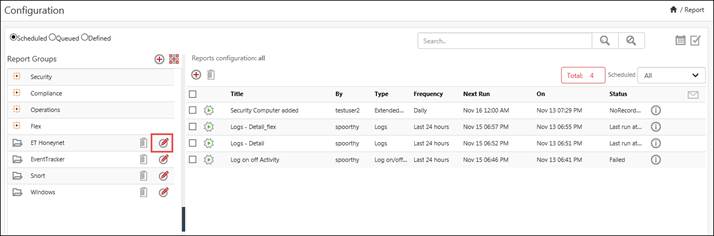
3. To Edit or Delete a group in Reports
Configuration tree, right-click any group, select Edit ![]() icon or Delete
icon or Delete ![]() icon accordingly.
icon accordingly.
4. To email a report, click Email ![]() icon.
icon.
5. Select any report option and then click
Information ![]() icon
to view the Report details and Exception details.
icon
to view the Report details and Exception details.
6. Enter/select the required options to generate Scheduled/Queued/Defined reports.
7. Select any report option and then click
the Run Now ![]() icon
to run the respective Scheduled/Queued/Defined reports.
icon
to run the respective Scheduled/Queued/Defined reports.
8. Select the Scheduled drop-down to run the report All / Daily /Last 24 hours/ Twice Daily / Hourly / Weekly /Last 1 week/Once in a Week/Monthly.
9. To search for a report, enter the search
criteria and click the Search ![]() icon.
icon.
10. To delete a report, select any report and
then select the Delete ![]() icon.
icon.
11. To view data about Reports in Calendar,
click Report Calendar ![]() icon.
icon.
12. To view status about Reports, click
Report Status ![]() icon.
icon.
1 Click the Reports menu, and then select Reports Configuration.
2 Select
the New ![]() icon.
icon.
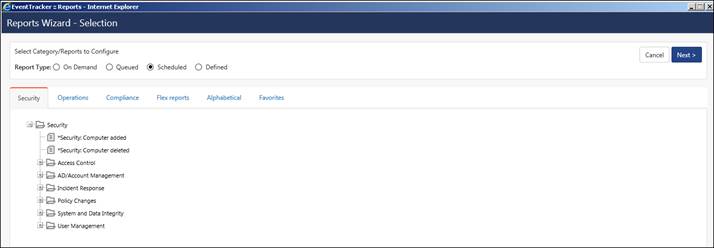
EventTracker displays the Reports page.
3 Select the required Security/Operations/Compliance/Flex Reports /Alphabetical/Favorites tab.
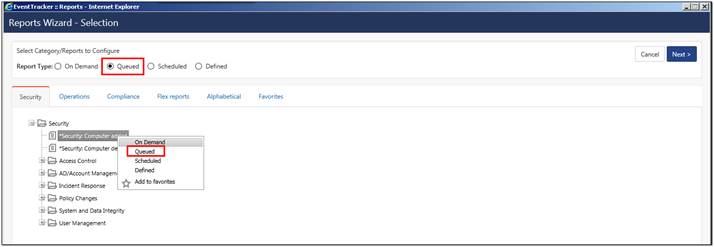
4 Select the required Report type i.e. On Demand, Queued, Scheduled, Defined.
5 Click Next>> and proceed further to generate a report.
Details to generate On Demand, Queued, Scheduled, Defined reports are explained below.
Reports that show the occurrence of various security related events across systems, devices, and applications. These may be generated and reviewed on a regular schedule to pinpoint potential risks or breaches. Security reports are useful to decisively counter the internal and external security threats.
System health monitoring is an important benefit of event log management. These reports are useful to observe anomalies in system performance (CPU, disk, memory), service failures, network connections, printer usage etc.
Reports that show the compliance posture of enterprise assets, and are helpful to demonstrate alignment with standards.
Flex Report is a client-side report generation component. It provides detail information about log, log volume, alerts, suspicious network traffic and cost saving reports.
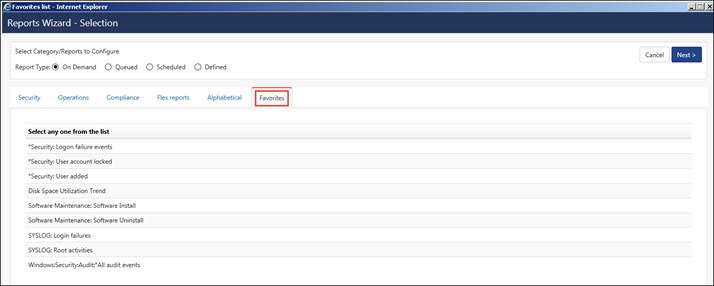
This tab will display all the category/reports/ flex reports that are added to the favorite list.
1 Log on to EventTracker Enterprise, click the Reports icon, and then select Dashboard or Configuration.
2 Click
the New ![]() iconin Dashboard
/ Configuration.
iconin Dashboard
/ Configuration.
3 Select any one of the Compliance / Security / Operations / Flex reports / Alphabetical tab.
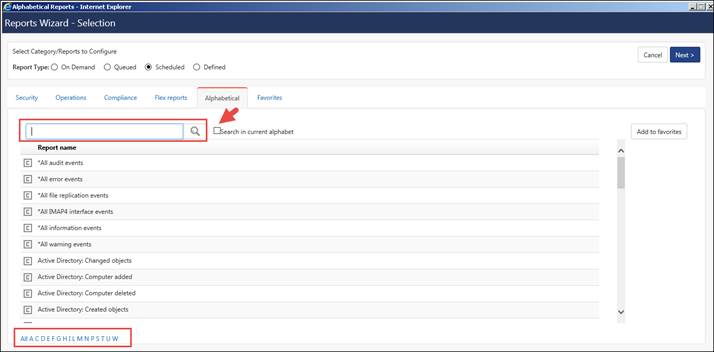
4 Click the alphabet hyperlink to view appropriate Category/Report/Flex Report list.
(OR)
Type
the search phrase in the search field, click the Search in current
alphabet checkbox, and then click the Search ![]() icon.
icon.
Example: alert
2 NOTE |
Search in current alphabet checkbox is not enabled when you click All hyperlink. |
EventTracker displays the Category/Reports/Flex Report searched for.
(OR)
5 Select a Category/Report/Flex Report from Report name column.
6 Click Next>>.
EventTracker displays the Reports Wizard. To generate On Demand, Queued, Scheduled and Defined reports are explained in detail in the next section.
2 NOTE |
You can also add Category/Reports/Flex Report to the favorites list. To do this select a Category/Reports/Flex Report and then click Add to favorites. Similarly you can generate Security, Operations, Flex and Compliance Reports.
|
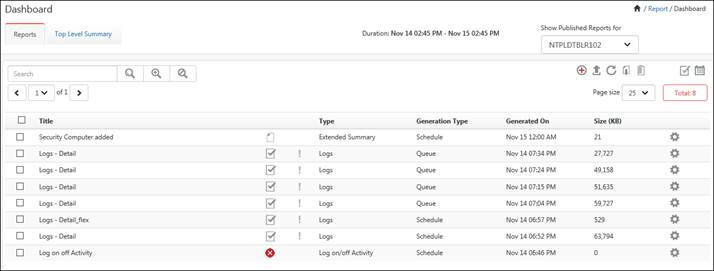
It displays all the reports generated in Alphabetical, Security, Compliance and Flex Reports.
1 Click the Reports icon, and then click Dashboard.
EventTracker displays the ‘Reports Dashboard’ page. In the top pane, Status Graph displays a graph showing Status of the reports, Generated By the respective Reports (Alphabetical/Security/Operations/Compliance/Flex Report).
2 NOTE |
In Reports, Export Type will only support for Excel & PDF. |
2 Click the New ![]() icon
in the Report Dashboard page, to generate the respective reports.
icon
in the Report Dashboard page, to generate the respective reports.
The detail to generate different Report Types in Security/Operations/Compliance/Flex Reports/Alphabetical is explained in the next section.
3 Click the respective PDF, Word icon to view detail report in Word or PDF format.
The second column displays the status of report.
Icon |
Description |
|
No record found |
|
Processing report |
|
Report generated successfully |
|
Failed to generate report |
|
Cancelled report |
4 Click the Flag ![]() icon
to change the status of the report.
icon
to change the status of the report.
Flag Icon |
Description |
|
Un-flagged and no action has been taken |
|
Flagged and relevant action is required for that particular incident to solve an issue |
|
Checked the report and necessary action has been taken care of |
Field |
Description |
Title |
Name of the report |
Type |
Formatting option of the report |
Generated By |
Type of report On Demand/Scheduled/Queued/Defined |
Generated on |
Date and time when the report was generated |
Size(kb) |
Size in KB of the report |
Report Status |
Status of the report such as Success, Failed, No data and Cancelled |
5 Select Info ![]() icon
from the gear icon in the right hand corner for viewing Report Details
and Exception Details.
icon
from the gear icon in the right hand corner for viewing Report Details
and Exception Details.
Report details window displays by default.
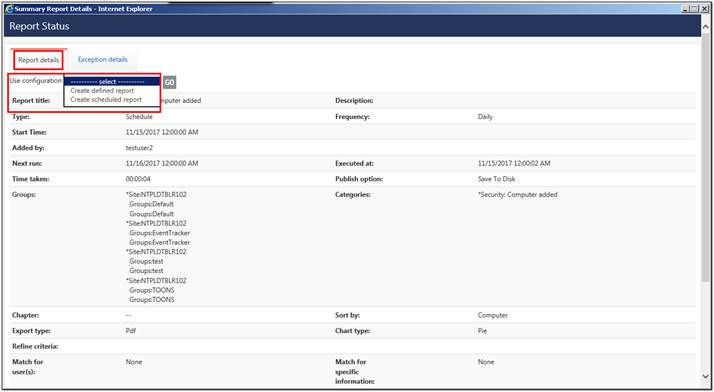
a. Select Use Configuration drop-down, select Create defined report or Create scheduled report.
b. Select Go hyperlink.
c. Select Exception Details to view details about the exceptions generated.
d. Select Flag for Follow up ![]() icon to add more
information.
icon to add more
information.
6 Select on Title hyperlink to view details about the report in PDF and Excel format etc.
Summary Report Details window displays.
7 Select Export ![]() icon to
export data to excel.
icon to
export data to excel.
8 Select Casebook ![]() icon from the drop
down list by clicking the
icon from the drop
down list by clicking the ![]() icon, to update
data in Log Book.
icon, to update
data in Log Book.
A Casebook message displays.
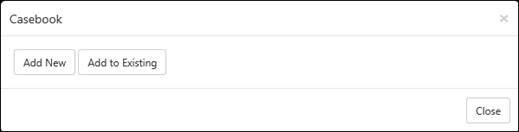
a) To add a new Casebook entry, click the Add new button.
b) To add to an existing Casebook, click the Add to existing button.
Casebook window displays.
c) Enter relevant data and then click Save.
For detail information, refer Casebook.
9 Click Notes ![]() icon
to add comments about a particular report.
icon
to add comments about a particular report.
10 For deleting any report, select the checkbox of the particular report and then click the Delete button to delete a report from the Dashboard view.
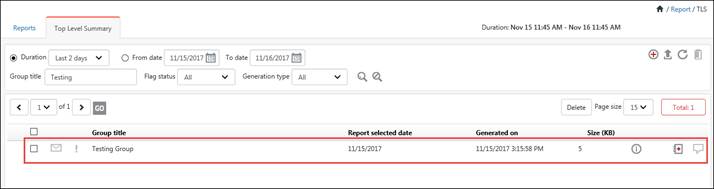
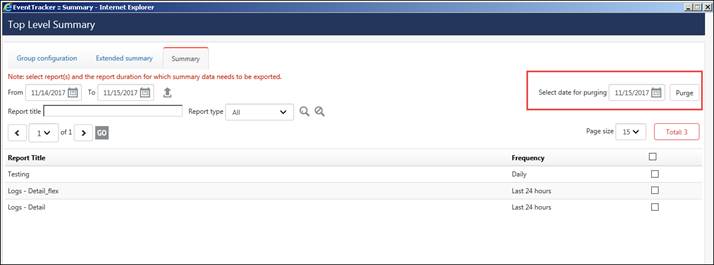
1 Click on the Top Level Summary tab, to display the Top Level Summary Data.
EventTracker: Top Level Summary Dashboard page is displayed.
The summary data of the generated scheduled reports is archived during report generation. Summary data is collected for specific type of reports like flex (log, log volume) and category based reports only.
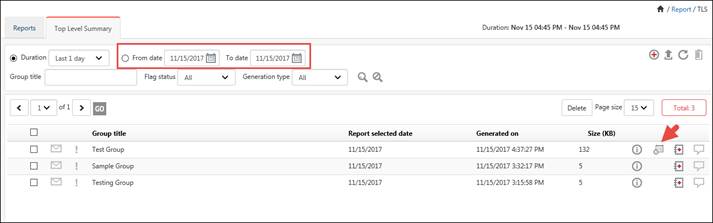
· The Top Level Summary tab will display
the scheduled and the on demand report groups that have been exported.
The scheduled ![]() icon
displays for the scheduled report groups. The user can select the date
range and search report as per requirement.
icon
displays for the scheduled report groups. The user can select the date
range and search report as per requirement.
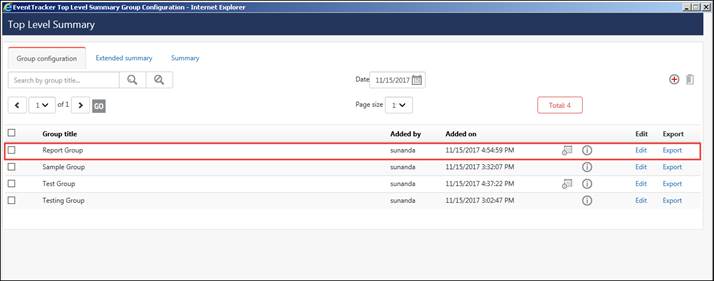
· For configuring a Top Level Summary
Group, select the Group Configuration icon![]() .
.
EventTracker displays the Group Configuration Tab.
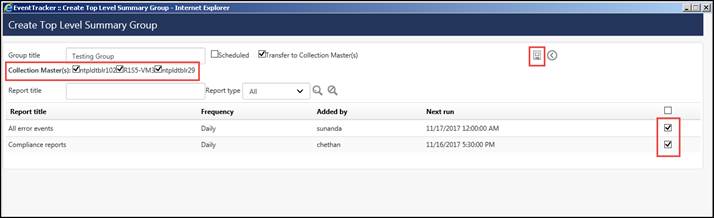
· Click the Add Group button to configure a Group.

· Enter a Group Title; select the reports to be added under the group by clicking the checkbox and then click on Save icon. Also select the checkbox Scheduled as shown in the figure below.
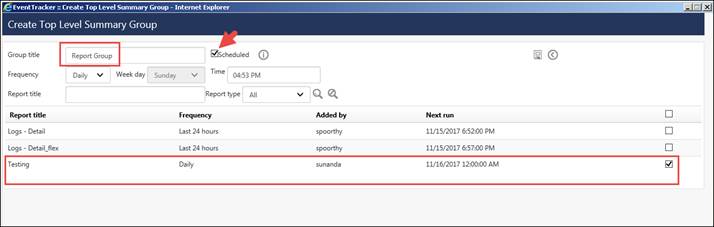
The Group gets added and is displayed in the Group Configuration page.
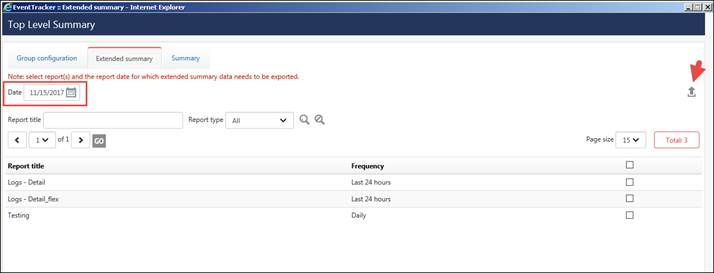
· In the Extended summary tab, the user can select the report(s) and the particular date for which the extended summary data needs to be exported.
· In the Summary tab, select the report (s) and the date range that needs to be exported in to excel files.
· You can also purge the reports up to a selected date by using Purge from Summary tab.
2 To get an Extended Summary of the report,
select the required Report titles and then select ![]() Export icon.
Export icon.
The selected reports are exported to an excel file.
3 To view data about Reports in Calendar,
click Report Calendar ![]() icon.
icon.
4 To view status about Reports, click
Report Status ![]() icon.
icon.
5 To search any report, enter relevant data in Search textbox and then click the Search button.
6 To perform an advance search, click the
Advanced Search ![]() icon
in the Report Dashboard page.
icon
in the Report Dashboard page.
Advanced Search window displays.
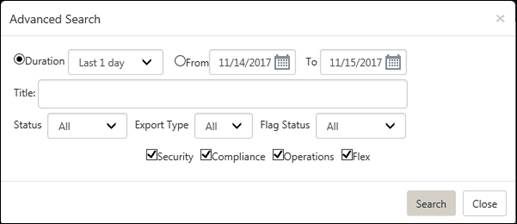
7 Enter/select relevant data and then click the Search button.
Relevant data is displayed based on the search criteria.
On Demand reports can be generated in the foreground and background as well. Reports that are generated in the foreground are called On Demand reports. Reports that are generated in the background are called Queued reports (explained in the next section).
1 Log on to EventTracker Enterprise, click the Reports menu, and then select Dashboard or Configuration.
2 Click
the New ![]() iconin Dashboard
/ Configuration.
iconin Dashboard
/ Configuration.
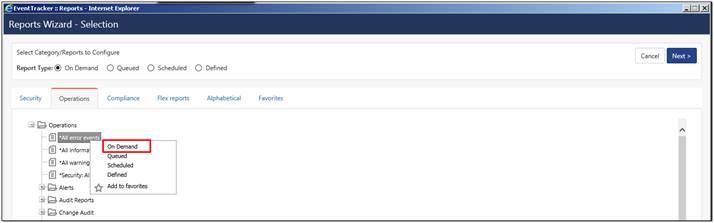
3 Select any one of the Compliance / Security / Operations / Flex reports/Alphabetical tab.
4 Expand the Report Tree node and select any report.
5 Select Report Type as On Demand.
(OR)
Right click the respective report and then select On Demand.
6 Click Next.
For Example: In Security menu, select All error events, right-click On Demand.
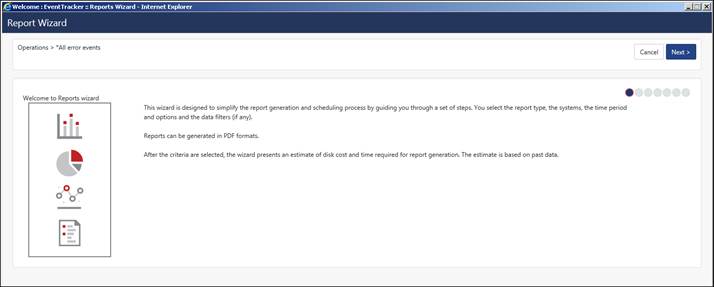
EventTracker displays the Reports Wizard.
7 Click Next >>.
8 Select the required options (like Sites, Group, Systems, Show all sites, All Systems).
9 Select Realtime or File Transfer and then click Next>>.

10 Select the required Interval and Limit to time Range option.
11 Select the required Format option (i.e. Summary, Extended Summary, Detail, Trend Report).
12 Select the required Export Type (i.e. PDF file, Word Document, HTML file, Quick View (not saved on hard disk).
13 Select the required Chart Type (i.e. Donut, Bar, Line graph).
14 Select Sort by (Computer or User).
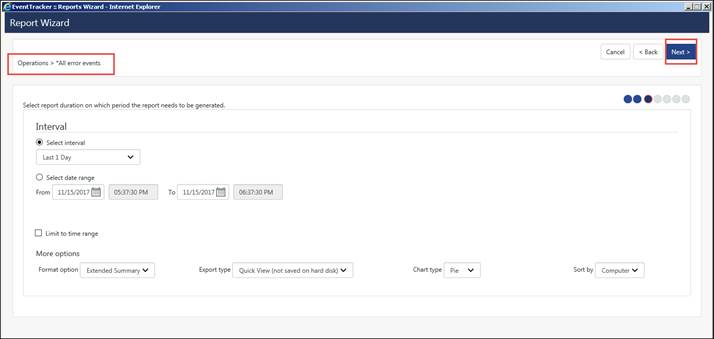
15 Click the Next>> button.
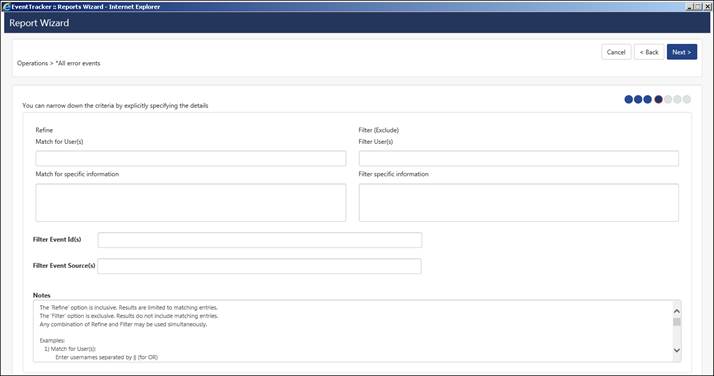
16 Enter the appropriate Refine and Filter details.
17 Click the Next>> button.
18 Enter the relevant Title, Header, Footer, and Description data.
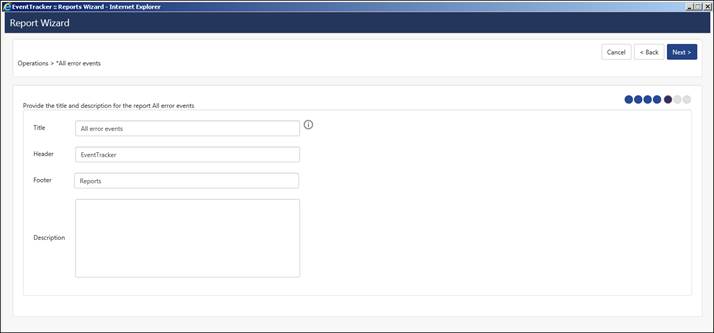
19 Click the Next>> button.
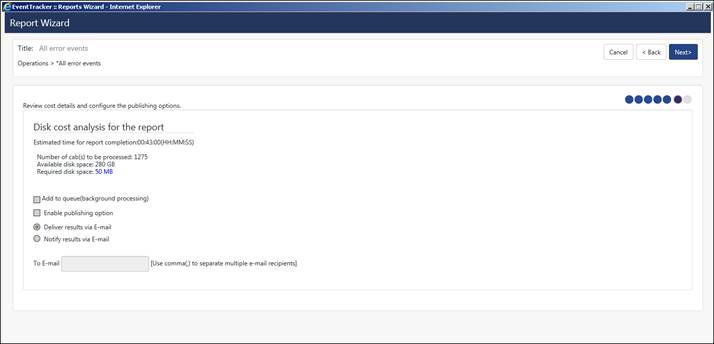
Review cost details and configure the publishing options window displays.
2 NOTE |
Publishing options are disabled because On Demand (foreground processing) has been selected. |
20 Click the Next>> button.
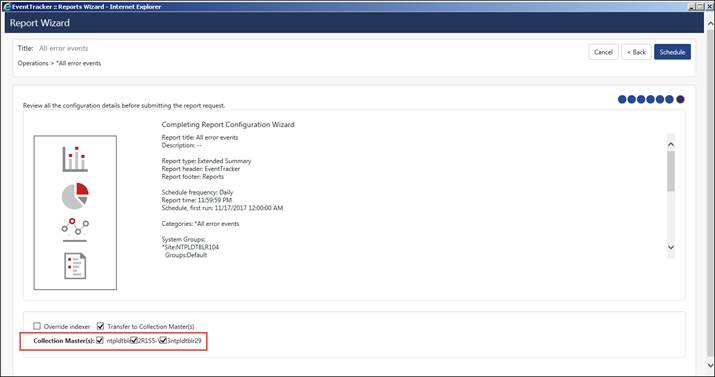
The last step of Completing Report Configuration Wizard displays.
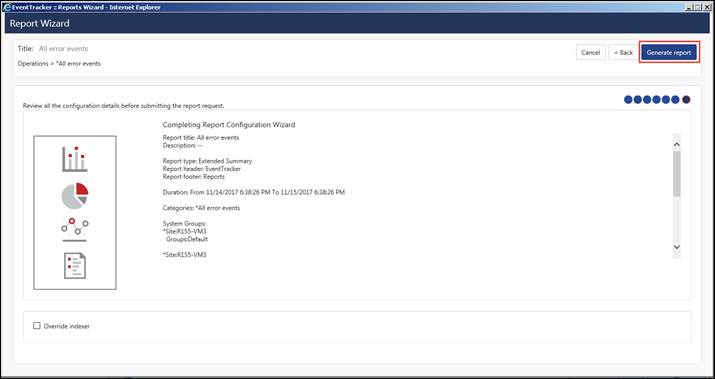
21 Select Override indexer if required, and then select Generate Report.
On enabling override indexer, the indexer will not be used for filtering the cabs and all cabs will be searched for data.
OR
To make any other modifications click Cancel to exit the Wizard or <<Back to revert to previous wizard window.
Generating reports window displays initializing report queue and displays the summary of report generated.
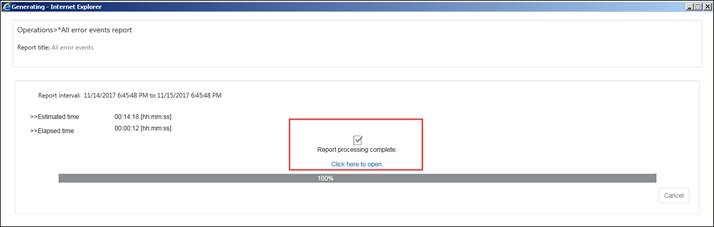
22 Click the hyperlink to view the report.
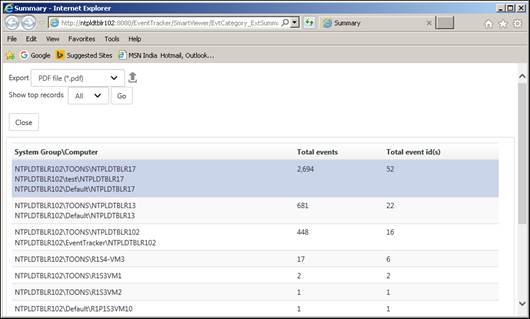
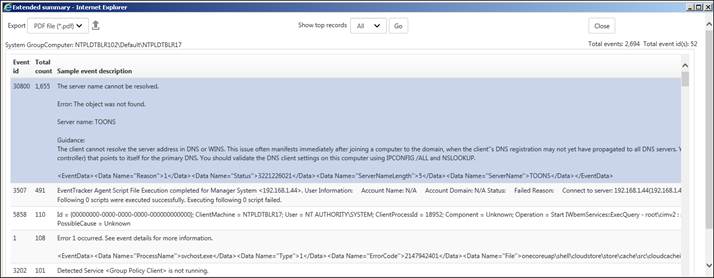
23 Select any one of the System Group\Computer hyperlink to view detail information.
Reports that are generated in the background are called Queued reports.
1 Log on to EventTracker Enterprise and then click the Reports menu.
2 Click
the New ![]() icon inDashboard /
Configuration.
icon inDashboard /
Configuration.
NOTE:
If
you select Queued in Reports Configuration, all queued reports are displayed
with results and their status. To run any report, click Run Now
![]() icon.
icon.
3 Select any one of the Compliance / Security / Operations / Flex reports / Alphabetical tab.
4 Expand the Report Tree node and select any report. Select any Report Type as Queued. Click Next.
For Example: In Compliance Report Tree, select Acceptable Use>Security: Logon failure events. Report Type selected is Queued.
EventTracker displays the Reports Wizard.
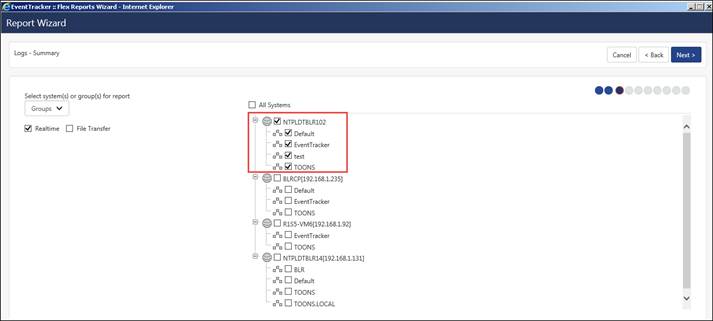
5 Select system(s) or group(s) for report and then click Next>>.
6 Select report duration on which period the report needs to be generated.
7 Select the appropriate Interval, Format option, Export type, Chart type and Sort by Computer or User.
8 Enter appropriate Refine and Filter options.
9 Click Next>>.
10 Enter the appropriate Title, Header and Footer details. Click Next>>.
11 To send results via E-mail, select Enable publishing option. Enter the correct E-mail address.
The last step of Reports Wizard displays.
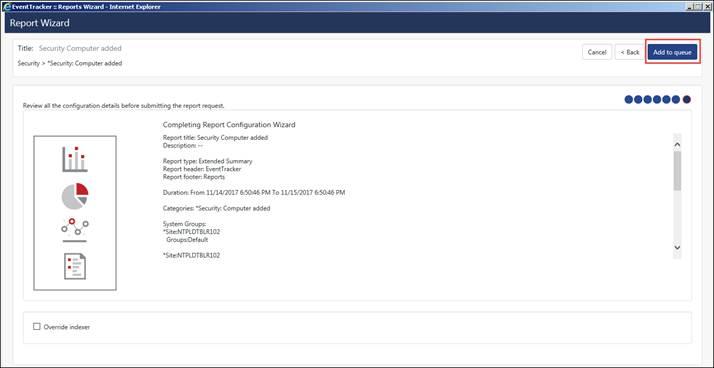
12 Select Override indexer if required, and then select Add to Queue.
On enabling override indexer, the indexer will not be used for filtering the cabs and all cabs will be searched for data. The report is added to the queue and generated appropriately.
Scheduled reports are used when you want to generate reports on specified date, time.
1 Log on to EventTracker Enterprise and then click the Reports menu.
2 Click
the New ![]() icon in Dashboard / Configuration.
icon in Dashboard / Configuration.
3 Select any one of the Compliance / Security / Operations / Flex reports / Alphabetical tab.
4 Expand the Report Tree node and select any report.
5 Select any Report Type as Scheduled.
(OR)
Right click the respective report and then select Scheduled.
Example: In ‘Flex Reports’ Report Tree, select Logs, select Summary. Report Type selected is Scheduled.

6 Click Next.
EventTracker displays the Reports Wizard.
7 Click Next >>.
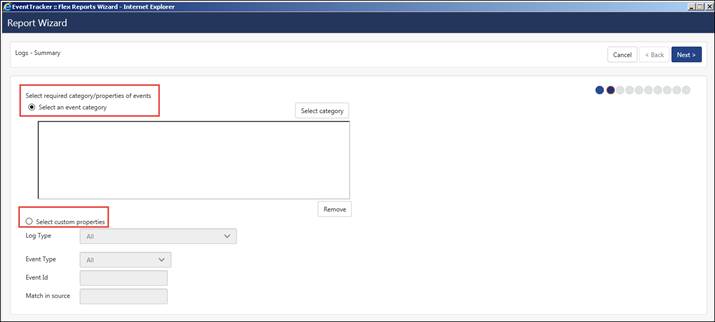
8 Select the required Select an event category or Select custom properties option. Also select the required Log Type, and then click the Next >> button.
9 In Select system(s) or group(s) for report pane, select the appropriate options and then click Next>>.
A warning message displays.
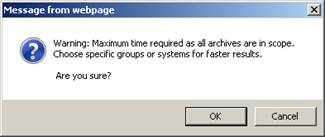
10 Click the OK button.
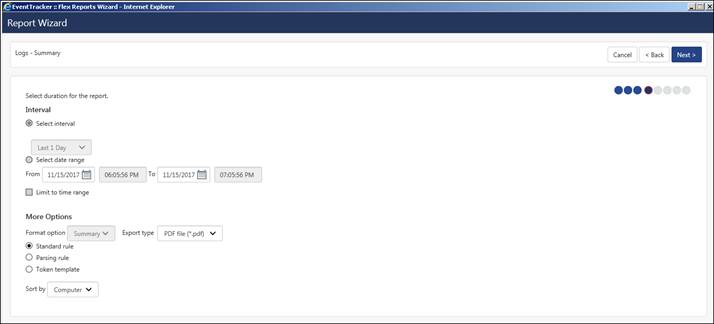
11 In Select duration for the report pane, select the appropriate Schedule options (Schedule Type:, Report Time:, Schedule Run Time:,).
Schedule type can be selected as Daily/Last 24 hours/Twice Daily/Weekly/Last 1 Week/Once in a week/Hourly/Monthly.
· “Daily” report type will have report time of 11:59:59 PM by default.
· For "Last 24 hours" type user can specify report time.
· “Weekly” selected report type will be from Sunday 12:00:00 AM to Next Saturday 11:59:59 PM.
· For “Last 1 week” Report type, user can select Report time, Scheduled run time and day of week and all other options remain same.
· If Schedule Type selected is Monthly, then an option to select date range and time range is provided i.e. Limit to date range and Limit to time range.
12 Select the required Format option (Standard Rule, Parsing Rule, Token Template), Export type, Sort by Computer or User.

Parsing Rule and Token Template is explained in detail in Parsing Rules.
13 Click Next>>.
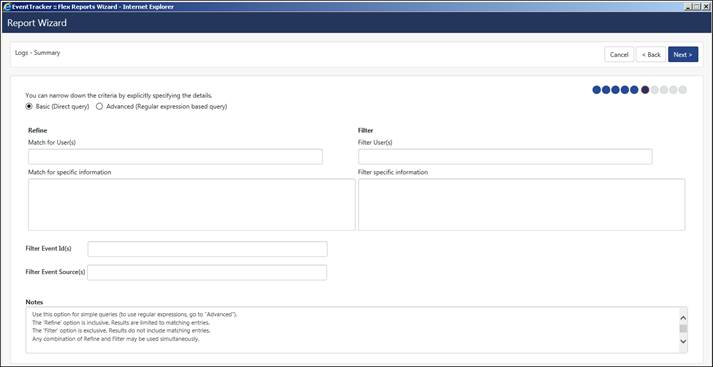
14 Select the required Refine and Filter Details.
2 NOTE |
• The transferred TLS reports from Collection Point will not display the selected reports, on clicking the information icon in Collection Master, in case the main reports are selected for transferring in Collection Point. • For a Fresh environment, i.e. v9.0, the user can generate report for only PDF and Excel export types. Even for Export Import Utility, the user can generate only PDF and Excel reports. • For an upgrade from older version to v9.0, the earlier configured report (HTML and DOCX), the reports will be generated in HTML and DOCX export types, until the user edits the reports and saves the changed configuration. The user can also generate the earlier configured report (HTML & DOCX) in the newer version, by importing it from EventTracker Control Panel> Export Import Utility.
|
15 Click Next>>.
16 Enter the appropriate Title, Header and Footer details.
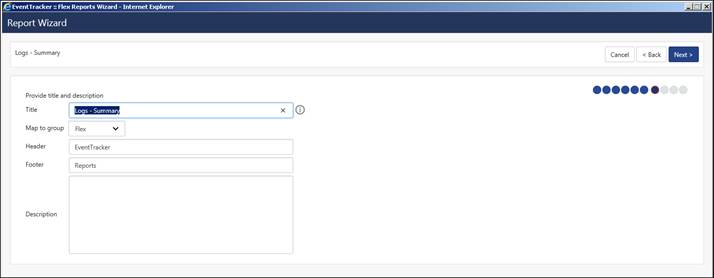
17 In Map to group drop-down, you can select the required groups.
18 Click Next>>.
19 To send results via E-mail, select Enable publishing option. Enter the correct E-mail address.
20 Select Update status via RSS: feed drop down. Select Show in Compliance Dashboard if required.

21 Click Next>>.
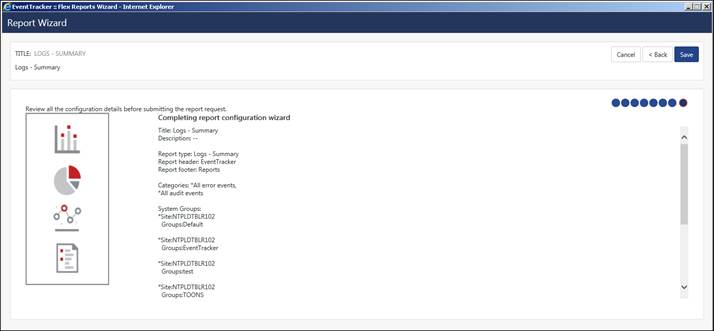
The last step of Report Configuration wizard displays.
22 Select Schedule.
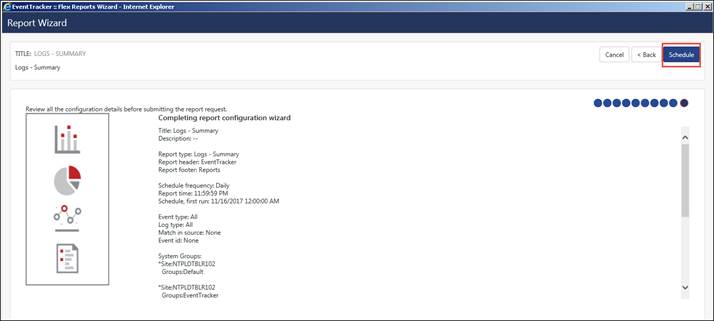
The corresponding report displays in Reports Configuration.
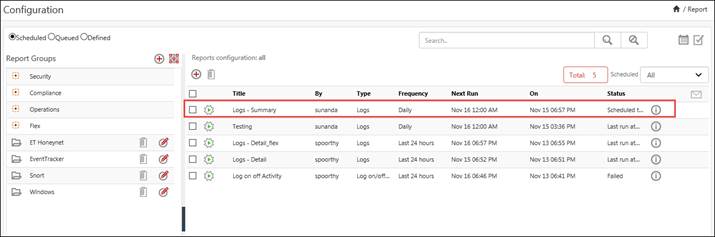
A new option has been added for the user to generate a single or multiple reports based on the duration selected and the type (daily/weekly etc...) in scheduled reports. Instead of generating 7 daily reports for a week, a single consolidated report can be generated.
1. Select Scheduled option, and then
select Run Now ![]() icon.
icon.
Scheduled run now window displays:
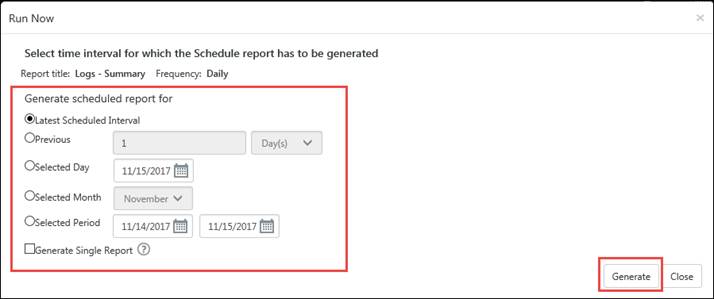
2. In Generate scheduled report for pane, select the required duration.
In our example we are selecting Previous 4 weeks.
3. Select Generate Single Report option.
4. Select Help ![]() icon
for additional information.
icon
for additional information.
5. Select the Generate button.
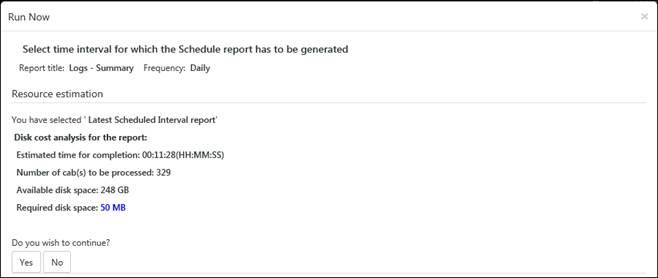
6. Verify Resource estimation and then select the Yes button.
Once the report is generated successfully, a message displays.
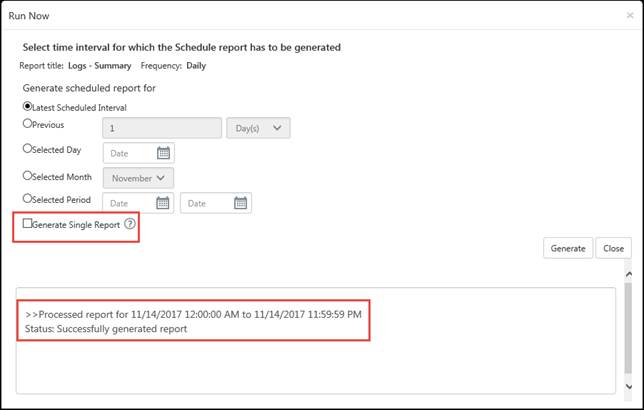
You can view the result in Reports dashboard.
Defined reports are used to generate the reports immediately.
1 Log on to EventTracker Enterprise and then click the Reports menu.
2 Click
the New ![]() icon inDashboard /
Configuration.
icon inDashboard /
Configuration.
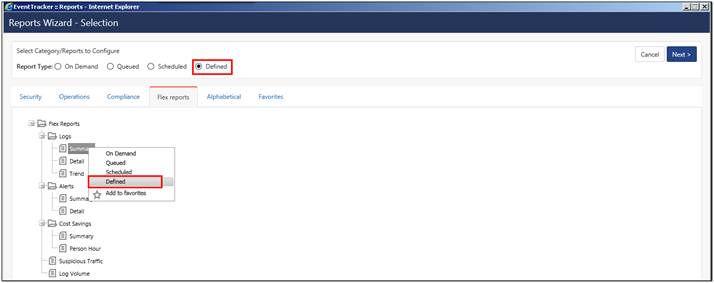
3 Select
Defined, and then select the New ![]() icon.
icon.
4 Select any one of the Compliance / Security / Operations / Flex reports / Alphabetical.
5 Expand the tree node, select any report, and then select Defined.
(OR)
Right click the respective report and then selectDefined.
For Example: In Flex Reports, select Logs Trend.
6 Select the Next button.
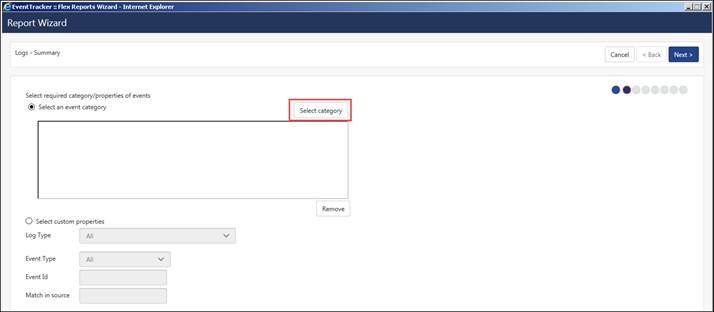
EventTracker displays the Reports Wizard.
7 Select an event category or custom properties option as per the requirement.
a) If Select and event category is checked, then Click Select Category hyperlink.
Categories window displays.
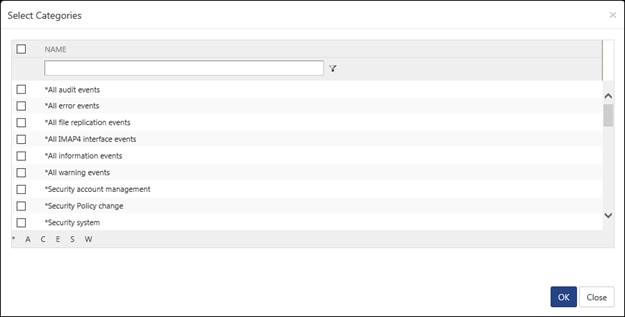
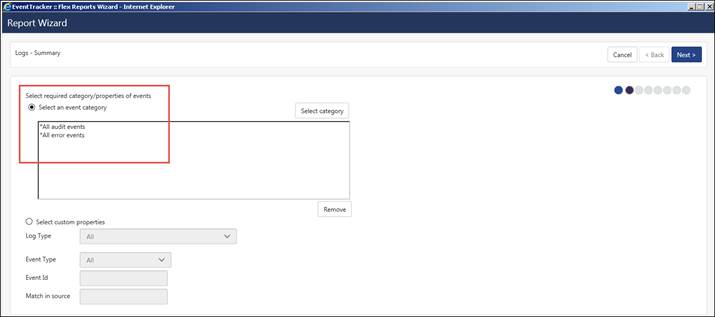
b) Select Name option to select all categories or any one of the respective categories, and then select the OK button.
In this example, all categories are selected.
(OR)
i. Select Select custom properties option.
ii. Enter the relevant Event Type, Event id, Match in Source and Log Type.
8 Click Next>>.
9 Select system(s) or group(s) for report and then click Next>>.
10 Select the duration of the report.
11 Select the required Refine and Filter (Exclude) details, and then click Next>>.
12 Enter the appropriate Title, Header and Footer details. Click Next>>.
13 To send results via E-mail, select Enable publishing option. Enter the correct E-mail address.
14 Select Update status via RSS: feed drop down. Select Show in Compliance Dashboard if required.
15 In the last step of Report Configuration Wizard, select Save.
The corresponding report displays inSecurity window.
16 To view report details, click the correspondingTitle in Security window. Click Next >>.
17 Verify the report details and then click Save.
Reports Wizard has been designed to simplify the report generation and scheduling process by guiding you through a set of steps. You can select the report type, the systems, the time period and options and also the data filters (if any).
Reports can be generated in PDF and Excel formats.
After the criteria are selected, the wizard presents an estimate of disk cost and time required for the report generation. The estimate is based on past data.
Exceptions that occurred during report generation are displayed in this page. You can also add and clear follow up notes for the exceptions.
Exceptions are raised under the following circumstances:
n Report generation fails.
n Report-processing time exceeds maximum allowed time (1 hour).
n E-mail fails.
Refine and Filter options in the Reports Wizard helps you to narrow down your filtering criteria while configuring reports.
Field |
Description |
Refine: Use this option if you are looking for specific information. |
|
Match for User(s) |
This field can take multiple strings separated by ||. || Stands for OR condition. Example- If you wish to generate a Log on/off Activity report for a specific user named "John" then, just enter John in the 'Match for User(s)' textbox. If you are looking for multiple users John, Leonard and Susan then, enter as John||Leonard||Susan. |
Match for specific information |
This field can take multiple strings separated with && or ||. && Stands for AND condition and || stands for OR condition. If you want to make a match on any of the special characters like "\", "^", "$", etc., then in the search string prefix this char with a backslash, like "\\" for a "\" and "\^" for a "^".Example- If you wish to generate a Printer Usage report for a specific printer named "FLR1PRINTER" then, just enter FLR1PRINTER in 'Filter for Specific Info' textbox. If you are wish to generate a Printer Usage report for a specific user "Susan", specific printer "FLR1PRINTER" and specific document "FinancialInfo.xls", you have to enter Susan in 'Match for User(s)' textbox and you have to enter FLR1PRINTER&&FinancialInfo.xls in 'Filter for Specific Info' textbox. |
Filter (Exclude): Use this option if you want to ignore specific information. |
|
Filter User(s) |
Type the user names to exclude from report generation. |
Filter specific information |
Type the information that you want to filter out in this field. Example- Suppose you want to generate software usage for a use and want to exclude all Microsoft applications from the report. Just enter Microsoft in this field. |
Use this option if you do not wish to see specific Event Id(s) or Event Source(s) |
|
Filter Event Id(s) |
Enter the Event ID(s), which you do not wish to see in the report. Use || as a separator to enter multiple Event Id(s). |
Filter Event Source(s) |
Enter the Event sources (s), which you do not wish to, see in the report. Use || as a separator to enter multiple Event Id(s). |
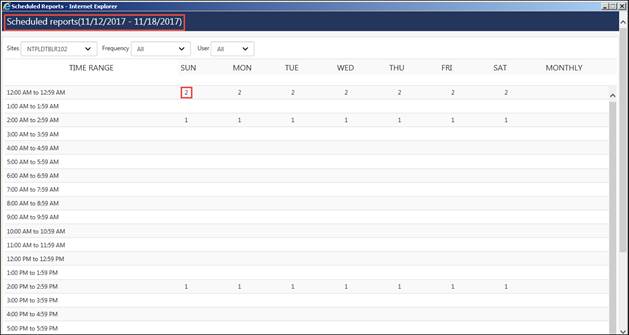
Report Calendar helps you view the time slots occupied by the scheduled reports & scheduled analyses and to use the free slots efficiently for new schedules. Exploiting the free time slots enhances the performance of reports engine, which ultimately speeds up the report generation. Report Calendar displays the time slots of the current week starting from Monday through Sunday.
1 To access
report calendar in Reports Dashboard or Configuration, click
Report Calendar ![]() icon.
icon.
EventTracker displays the Report Calendar in a pop-up window.
Click |
To |
Frequency |
Select a frequency from this drop-down list to view respective reports. |
Time range |
To view reports scheduled in that time slot. |
Day |
To view reports scheduled on that day. |
Show reports |
EventTracker selects this checkbox and displays all reports schedules. Clear this checkbox and EventTracker displays only the reports schedules. |
User |
To view reports scheduled by a particular user |
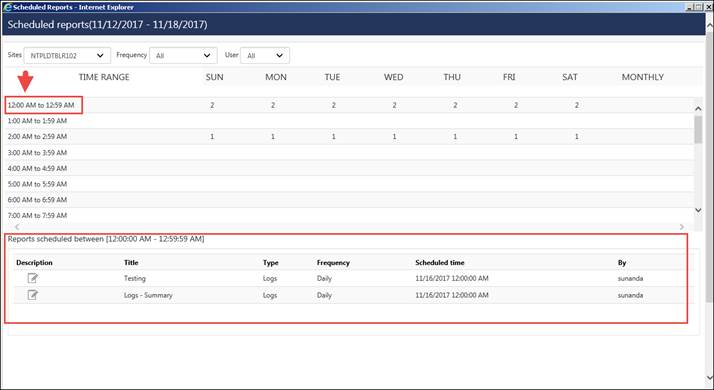
1 Click the hyperlinks under Time range.
EventTracker displays the reports / flex scheduled in that time slot.
Click |
To |
Title |
Title of the scheduled reports |
Type |
Type of the scheduled reports |
Frequency |
Frequency of the report generation |
Scheduled Time |
Date and time set for report generation |
Configured By |
Name of the user who configured the report |
2 Click
![]() to view the descriptions.
to view the descriptions.
EventTracker displays read-only descriptions.
1 To view scheduled reports on a day, click the name of the day.
EventTracker displays the reports scheduled on that day.
2 To view scheduled reports on a particular day and a time slot, click the links at the intersection of Time range and Day.
EventTracker displays the reports scheduled on that day and time slot.
Report snapshot displays the Overview and Queue status of the reports and flex irrespective of the Collection Point Site. Report Status shows the status of all reports generated in Security/Operations/Compliance/Flex Reports via On Demand, Queued, and Scheduled types.
1 Click
the Report Status ![]() icon.
icon.
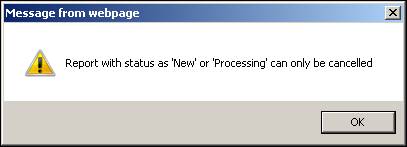
EventTracker displays a message. Click OK.
EventTracker displays the Report Status Snapshot pop-up window.

Field |
Description |
Active Users |
No of user logged on to EventTracker. |
User |
Select a user from this drop-down list to view the count of all reports configured by that user. EventTracker populates this drop-down list only when the logged in user has Admin privilege. |
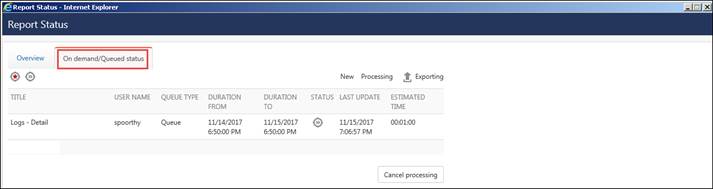
1. Click On Demand/Queued Status button.
Reports Status displays.
Field |
Description |
Title |
Name of the report / flex report |
User name |
Name of the user who configured the report / flex report |
Queue type |
Says whether report is Queued or On Demand. |
Duration from |
Report generation interval start time. EventTracker considers events occurred at this time onwards. |
Duration to |
Report generation interval end time. EventTracker considers events occurred till this time. |
Status |
Indicates the report generation stages. |
Last update |
Date and time when the report generation was initiated. |
Estimated time |
Approximate time require to generate the report / flex report |
Cancel processing |
Click to abort report generation. |
2. Select a report and click the Cancel Processing button.
The On Demand/Queued report is cancelled.
1 Log on to EventTracker Enterprise and then click the Reports menu.
2 Click
the New ![]() icon in Dashboard /
Configuration.
icon in Dashboard /
Configuration.
3 Select Alphabetical tab.
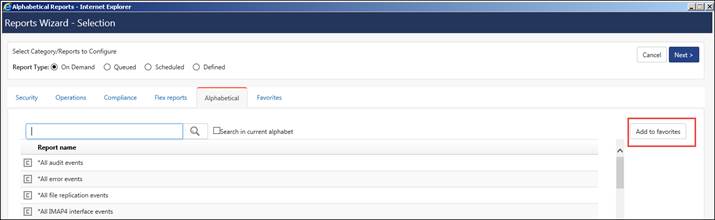
4 Select any report and then select the Add to Favorites tab.
5 To view favorites click the Favorites tab.
6 To generate a report, select any report and the Report Type.
7 Click Next and proceed further as mentioned earlier in order to generate different reports.
Existing Report/Log Search architecture goes through the typical CAB file processing for generating report or finding out specific data based on the given criteria. In real time environments (on heavy load scenarios, unknown conditions and multiple searches) this process takes lot of time and does not solve the immediate queries. Easy way to process quickly is to have the archived events in a cache, so that redundant processing of CAB files is eliminated.
Based on the given criteria EventVault generates search result from cache and saves the search results as Search history for future reference.
Run ad-hoc reports and save the data in a database. You can further drill-down the cached data by,
n Specifying Location, words, exact word/phrase or range of Event Id, in Advance search
n Selecting existing Category
n Constructing your own SQL Query
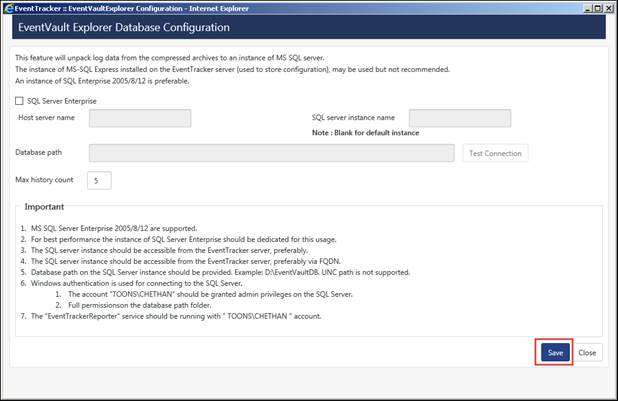
User can also configure EventVault Explorer to use remote SQL Server database. The reason is that the SQL Server Express Edition has maximum database size limitation of 4 GB. Hence, to overcome this limitation an option is provided to use Remote SQL Server, which can be SQL Server Enterprise Full Edition. Unlike SQL Server Express Edition, SQL Server Enterprise Edition does not have any size limitation.
This option helps you to search CAB files.
1 Click the Reports icon, click Explorer, and then click the New Search tab.
EventTracker displays the EventVault Explorer.

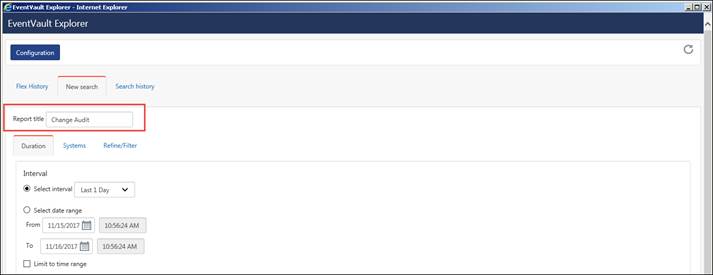
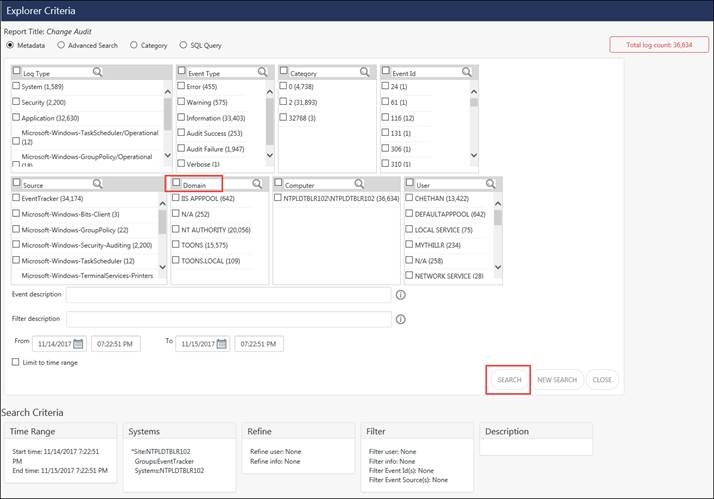
2 Enter the Report title.
Ex: Change Audit
3 In Duration tab, select the Interval.
4 In Systems tab, select any one of the Sites / Groups / Systems option.
You can also select Show all sites/All Systems or Search System(s).
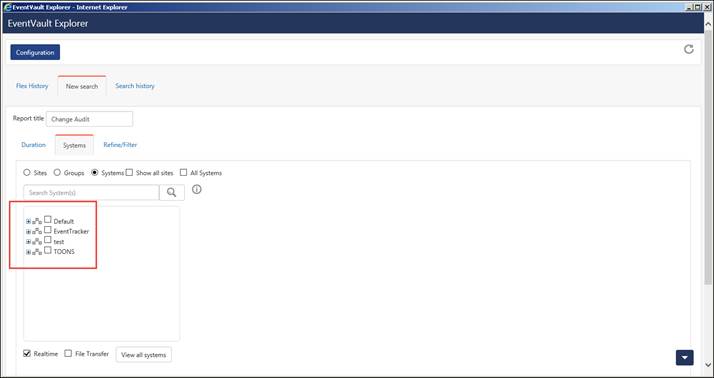
5 Set the Refine / Filter criteria.

6 Enter an appropriate Description.
7 Click Search.
EventTracker displays the Disk cost analysis pop-up window.
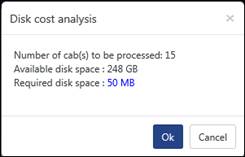
8 Click OK.
EventTracker displays information message box.
9 Click OK.
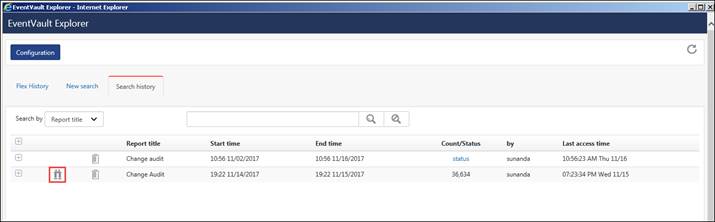
EventTracker displays Search History tab with the result set. By default only 5 searches can be made but the user can increase it by changing the configuration settings (To change Configuration setting, click Configuration hyperlink and set the Max history count).

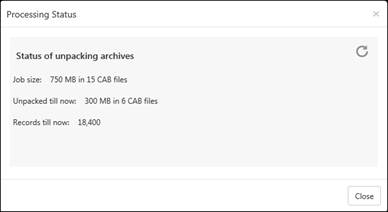
10 Click the Status hyperlink.
EventTracker displays EventVault Explorer processing status window.
Status |
For |
Initializing |
New request |
Processing |
Cab Extraction |
Exception Occurred |
Failed |
Status of unpacking Archives |
All the archives have been processed (unpacked) successfully. |
It provides detail information about Flex Reports that have been configured, since the reports are flexible. For a detailed flex report, when you select the option to persist data for a certain period, reports get appended for that period. Later the reports get purged.
The standard columns provided in EventTracker are Log Type, Source, Event ID, Event Type, Category, Domain, System, User and Description.
You can create and extract your own custom columns from the standard columns provided. The results can be extracted in an excel file since it supports all excel features. It allows you to browse through underlined data.
For example:
If you need information about User, Log Type and Source only, then flex history can be configured to fetch the required data.
1 Click the Reports icon, and then select Explorer.
EventTracker displays the EventVault Explorer.
2. Go to New Search tab; enter the Report Title, the Date range/ Time range and also the System Name.
4. Select
the Explore ![]() icon.
icon.
Flex Data Refine window displays.
5. Select the required options and then select the Search button.
Ex: Select Domain option, and then click Search.
Show Refined Data window displays.
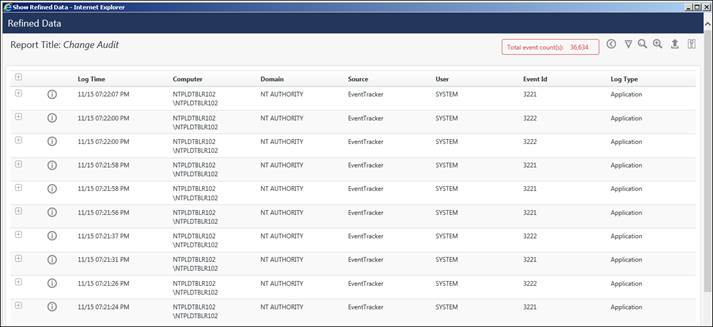
6. To view data volume,
click Data Volume ![]() icon.
icon.

7. To refine and narrow down the search criteria, click Refine icon.
8. Select the Refine option button.
Flex Refine Dialog displays.
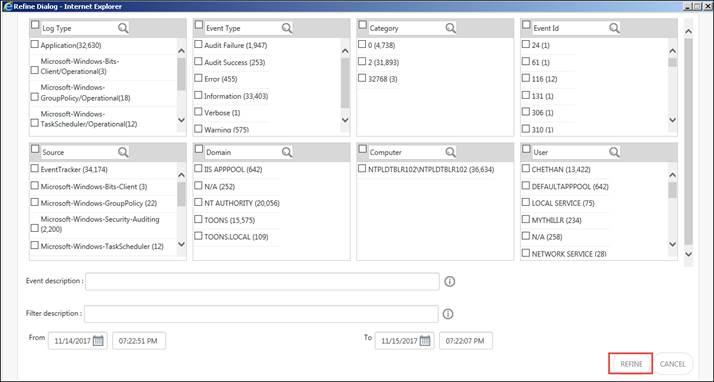
10. Enter the relevant search criteria and then click Refine.
11. To return to flex history tab, click the Flex History button.
12. To search data, click Search again icon.
13. To export data to excel, click Export icon.
2 NOTE |
• MS SQL Server Enterprise 2005 / 2008 / 2012 are supported. • For best performance, the instance of SQL Server Enterprise should be dedicated for this usage. • The SQL Server instance should be accessible from the EventTracker server, preferably via fully qualified domain name (FQDN). • Windows authentication is used for connecting to the SQL Server.
|
For successful configuration, please follow the steps given below:
· Grant user (User used for EventTracker configuration) Sysadmin access on remote SQL Server.
· Create folder on remote SQL Server system to store EventVault Explorer database file and give user (User used for EventTracker configuration) full access on folder created on the remote system.
1. Click the ‘Reports’ icon, select ‘Explorer’.
The EventVault Explorer window will appear on the screen.
2 NOTE |
With the new User Interface enhancement provided in v8.3, the EventVault Explorer will now support the following changes: · Faster Data loading · Quick access to columns with the top records. · Time Selection options (Quick, Relative and Absolute). · Expand and Collapse for the available column option. · Include/Exclude metadata from available columns. |
For more information, refer the section- “EventVault Explorer” in Eventvault-explorer-Behavior-and-Tile-Dashboard-enhancement.
2. Click Configuration hyperlink.
EventVault Explorer Database Configuration window displays.
2 NOTE |
For more details, refer EventVault Explorer – Introduction and Usage document. |
To send Collection Point generated reports to Collection Master, first of all the user has to save the configuration (Refer: Collection Point/Collection Master)
For the existing configured and saved reports,
the Send to Collection Master icon ![]() will
be available in Reports Configuration & Top Level Summary.
will
be available in Reports Configuration & Top Level Summary.
2 NOTE |
The added notes for PDF report in Collection Point will not be transferred to Collection Master. |
For configuring Reports,
· Click Reports> Configuration.
· Click the Send to Collection Master
Icon![]() .
.
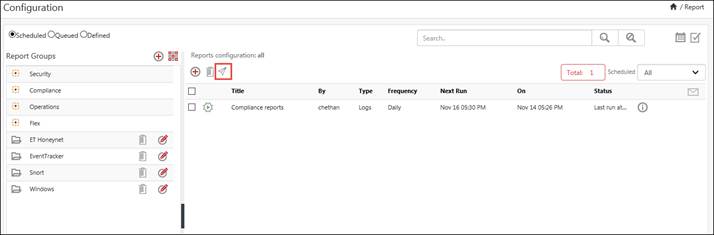
The configure reports to Collection Master window displays.
· Select the Collection Master(s), where the Collection Point generated report(s) needs to be forwarded.
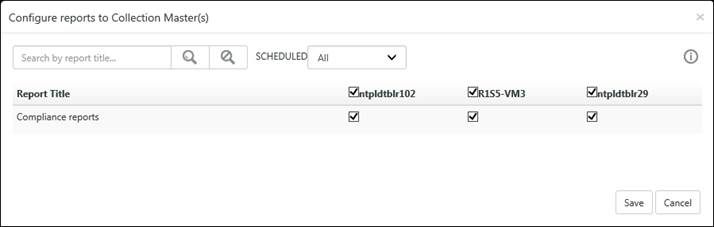
(For Scheduled report type)
NOTE 1: For Queued Type report, the figure is displayed below:
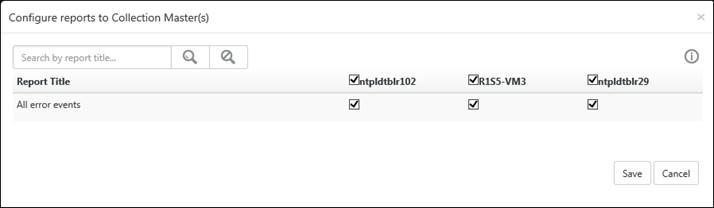
(For Queued report type)
· Select the Save button.
NOTE 2: The user can also select the Collection Master (s) from the Report wizard in the Final step.
· The Send to Collection Master icon
![]() will be displayed for all the individual configured
reports. The figure is displayed below:
will be displayed for all the individual configured
reports. The figure is displayed below:
· To get the report(s) detail and history,
click the information icon![]() .
.
For configuring Top Level Summary,
· Click Reports > Dashboard > Top Level Summary.
· Click the group configuration icon![]() .
.
· In the Top Level Summary page, the Send
to Collection Master icon![]() ,
will be visible, for the existing group reports.
,
will be visible, for the existing group reports.
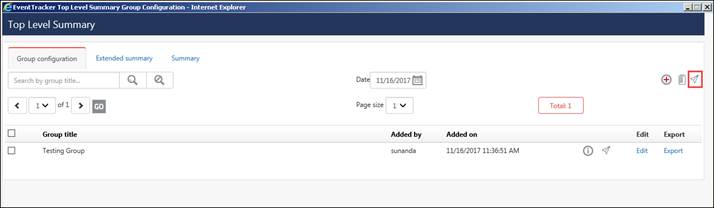
· Click the icon ![]() to
forward the TLS reports to CM.
to
forward the TLS reports to CM.
· Select the Collection Master(s) checkbox where you wish to forward the reports.

· Click the Save button.
Also while creating a new group in TLS, the user can send the group reports to the respective CM(s).
1. Click the Add group icon ![]() and create the group
by selecting the reports.
and create the group
by selecting the reports.
2. Check the Transfer to CM checkbox and select the respective CM(s).
3. Click the save icon ![]() after
making the changes.
after
making the changes.
This is shown in the figure below:
For Reports,
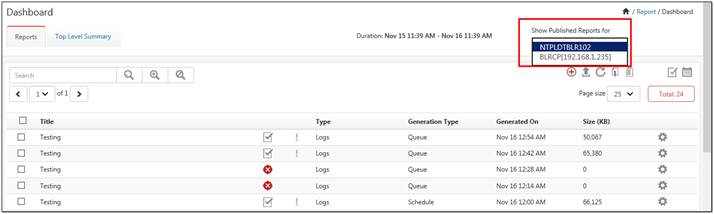
· Navigate to Reports > Dashboard.
· In the right-hand side, an option “Show Published Report for” is available.
2 NOTE |
Click
the |
· Select the Collection Point site from the drop down list, for which you wish to view the report.
For Top Level Summary,
· In Show Published reports for, select the CP site from the dropdown box.
The report(s) gets displayed.